
Page 77 - Applied Petroleum Geomechanics
P. 77
68 Applied Petroleum Geomechanics
80
Baxter shale
70 Haynesville shale
Linear (Baxter shale)
60 Linear (Haynesville shale)
(GPa) 50
Es 40 y = 0.7399x - 5.5678
R² = 0.9122
30
20 y = 0.7255x - 8.8453
R² = 0.9506
10
0
0 10 20 30 40 50 60 70 80
Ed (GPa)
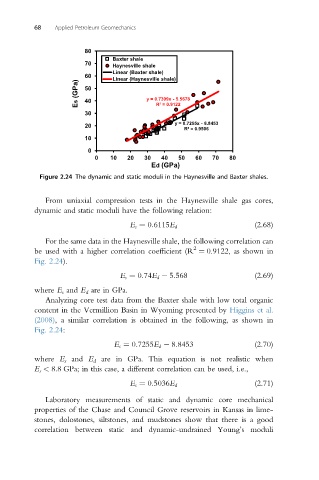
Figure 2.24 The dynamic and static moduli in the Haynesville and Baxter shales.
From uniaxial compression tests in the Haynesville shale gas cores,
dynamic and static moduli have the following relation:
E s ¼ 0:6115E d (2.68)
For the same data in the Haynesville shale, the following correlation can
2
be used with a higher correlation coefficient (R ¼ 0.9122, as shown in
Fig. 2.24).
E s ¼ 0:74E d 5:568 (2.69)
where E s and E d are in GPa.
Analyzing core test data from the Baxter shale with low total organic
content in the Vermillion Basin in Wyoming presented by Higgins et al.
(2008), a similar correlation is obtained in the following, as shown in
Fig. 2.24:
E s ¼ 0:7255E d 8:8453 (2.70)
where E s and E d are in GPa. This equation is not realistic when
E s < 8.8 GPa; in this case, a different correlation can be used, i.e.,
E s ¼ 0:5036E d (2.71)
Laboratory measurements of static and dynamic core mechanical
properties of the Chase and Council Grove reservoirs in Kansas in lime-
stones, dolostones, siltstones, and mudstones show that there is a good
correlation between static and dynamic-undrained Young’s moduli