
Page 80 - Applied Petroleum Geomechanics
P. 80
Rock physical and mechanical properties 71
0.4
y = 1.3708x
0.3
νh 0.2
0.1 Haynesville shale
Eagle Ford shale outcrop
Sone, 2010
Thiercelin & Plumb, 1994
Linear (Haynesville shale)
0
0 0.1 0.2 0.3 0.4
νV
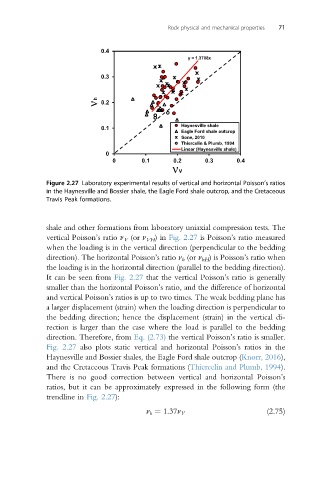
Figure 2.27 Laboratory experimental results of vertical and horizontal Poisson’s ratios
in the Haynesville and Bossier shale, the Eagle Ford shale outcrop, and the Cretaceous
Travis Peak formations.
shale and other formations from laboratory uniaxial compression tests. The
vertical Poisson’s ratio n V (or n VH )in Fig. 2.27 is Poisson’s ratio measured
when the loading is in the vertical direction (perpendicular to the bedding
direction). The horizontal Poisson’s ratio n h (or n hH ) is Poisson’s ratio when
the loading is in the horizontal direction (parallel to the bedding direction).
It can be seen from Fig. 2.27 that the vertical Poisson’s ratio is generally
smaller than the horizontal Poisson’s ratio, and the difference of horizontal
and vertical Poisson’s ratios is up to two times. The weak bedding plane has
a larger displacement (strain) when the loading direction is perpendicular to
the bedding direction; hence the displacement (strain) in the vertical di-
rection is larger than the case where the load is parallel to the bedding
direction. Therefore, from Eq. (2.73) the vertical Poisson’s ratio is smaller.
Fig. 2.27 also plots static vertical and horizontal Poisson’s ratios in the
Haynesville and Bossier shales, the Eagle Ford shale outcrop (Knorr, 2016),
and the Cretaceous Travis Peak formations (Thiercelin and Plumb, 1994).
There is no good correction between vertical and horizontal Poisson’s
ratios, but it can be approximately expressed in the following form (the
trendline in Fig. 2.27):
n h ¼ 1:37n V (2.75)