
Page 208 - Applied Probability
P. 208
9. Descent Graph Methods
each putative position of the trait locus, the observed marker phenotypes
determine the conditional probabilities of the different descent graphs at
the trait locus. A given descent graph partitions the set of genes of affected
people at the trait locus into blocks. Two genes belong to the same block
if and only if they are identical by descent. Good nonparametric linkage
statistics quantify the clustering of genes in such partitions. 193
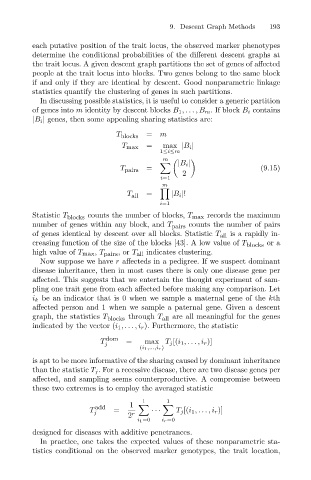
In discussing possible statistics, it is useful to consider a generic partition
of genes into m identity by descent blocks B 1 ,...,B m .Ifblock B i contains
|B i | genes, then some appealing sharing statistics are:
T blocks = m
T max = max |B i |
1≤i≤m
m
|B i |
= (9.15)
T pairs
2
i=1
m
T all = |B i |!
i=1
Statistic T blocks counts the number of blocks, T max records the maximum
number of genes within any block, and T pairs counts the number of pairs
of genes identical by descent over all blocks. Statistic T all is a rapidly in-
creasing function of the size of the blocks [43]. A low value of T blocks or a
high value of T max , T pairs ,or T all indicates clustering.
Now suppose we have r affecteds in a pedigree. If we suspect dominant
disease inheritance, then in most cases there is only one disease gene per
affected. This suggests that we entertain the thought experiment of sam-
pling one trait gene from each affected before making any comparison. Let
i k be an indicator that is 0 when we sample a maternal gene of the kth
affected person and 1 when we sample a paternal gene. Given a descent
graph, the statistics T blocks through T all are all meaningful for the genes
indicated by the vector (i 1 ,...,i r ). Furthermore, the statistic
T j dom = max T j [(i 1 ,...,i r )]
(i 1 ,...,i r )
is apt to be more informative of the sharing caused by dominant inheritance
than the statistic T j . For a recessive disease, there are two disease genes per
affected, and sampling seems counterproductive. A compromise between
these two extremes is to employ the averaged statistic
1 1
1
T j add = ··· T j [(i 1 ,...,i r )]
2 r
i 1 =0 i r =0
designed for diseases with additive penetrances.
In practice, one takes the expected values of these nonparametric sta-
tistics conditional on the observed marker genotypes, the trait location,