
Page 236 - Applied Probability
P. 236
10. Molecular Phylogeny
222
regions, which contain the oxygen binding site. Figure 10.8 displays the
generally accepted phylogeny connecting these taxa.
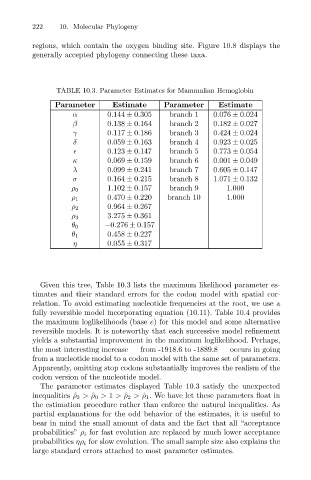
TABLE 10.3. Parameter Estimates for Mammalian Hemoglobin
Parameter Estimate Parameter Estimate
α 0.144 ± 0.305 branch 1 0.076 ± 0.024
β 0.138 ± 0.164 branch 2 0.182 ± 0.027
γ 0.117 ± 0.186 branch 3 0.424 ± 0.024
δ 0.059 ± 0.163 branch 4 0.923 ± 0.025
0.123 ± 0.147 branch 5 0.773 ± 0.054
κ 0.069 ± 0.159 branch 6 0.001 ± 0.049
λ 0.099 ± 0.241 branch 7 0.605 ± 0.147
σ 0.164 ± 0.215 branch 8 1.071 ± 0.132
1.102 ± 0.157 branch 9 1.000
ρ 0
0.470 ± 0.220 branch 10 1.000
ρ 1
0.964 ± 0.267
ρ 2
3.275 ± 0.361
ρ 3
−0.276 ± 0.157
θ 0
0.458 ± 0.227
θ 1
η 0.055 ± 0.317
Given this tree, Table 10.3 lists the maximum likelihood parameter es-
timates and their standard errors for the codon model with spatial cor-
relation. To avoid estimating nucleotide frequencies at the root, we use a
fully reversible model incorporating equation (10.11). Table 10.4 provides
the maximum loglikelihoods (base e) for this model and some alternative
reversible models. It is noteworthy that each successive model refinement
yields a substantial improvement in the maximum loglikelihood. Perhaps,
the most interesting increase — from -1918.6 to -1889.8 — occurs in going
from a nucleotide model to a codon model with the same set of parameters.
Apparently, omitting stop codons substantially improves the realism of the
codon version of the nucleotide model.
The parameter estimates displayed Table 10.3 satisfy the unexpected
inequalities ˆ ρ 3 > ˆ ρ 0 > 1 > ˆ ρ 2 > ˆ ρ 1 . We have let these parameters float in
the estimation procedure rather than enforce the natural inequalities. As
partial explanations for the odd behavior of the estimates, it is useful to
bear in mind the small amount of data and the fact that all “acceptance
probabilities” ρ i for fast evolution are replaced by much lower acceptance
probabilities ηρ i for slow evolution. The small sample size also explains the
large standard errors attached to most parameter estimates.