
Page 231 - Applied Probability
P. 231
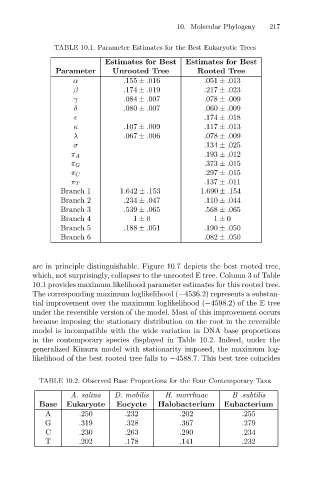
TABLE 10.1. Parameter Estimates for the Best Eukaryotic Trees
                                                                      Estimates for Best
                                                                         Rooted Tree
                                                   Unrooted Tree
                                     Parameter
                                                      .155 ± .016
                                         α
                                                                           .051 ± .013
                                         β       Estimates for Best 10. Molecular Phylogeny  217
                                                                           .217 ± .023
                                                      .174 ± .019
                                         γ            .084 ± .007          .078 ± .009
                                         δ            .080 ± .007          .060 ± .009
                                                                           .174 ± .018
                                         κ            .107 ± .009          .117 ± .013
                                         λ            .067 ± .006          .078 ± .009
                                         σ                                 .134 ± .025
                                         π A                               .193 ± .012
                                         π G                               .373 ± .015
                                                                           .297 ± .015
                                         π C
                                                                           .137 ± .011
                                         π T
                                      Branch 1       1.642 ± .153         1.690 ± .154
                                      Branch 2        .234 ± .047          .110 ± .044
                                      Branch 3        .539 ± .065          .568 ± .065
                                      Branch 4           1 ± 0                1 ± 0
                                      Branch 5        .188 ± .051          .190 ± .050
                                      Branch 6                             .082 ± .050
                              are in principle distinguishable. Figure 10.7 depicts the best rooted tree,
                              which, not surprisingly, collapses to the unrooted E tree. Column 3 of Table
                              10.1 provides maximum likelihood parameter estimates for this rooted tree.
                              The corresponding maximum loglikelihood (−4536.2) represents a substan-
                              tial improvement over the maximum loglikelihood (−4598.2) of the E tree
                              under the reversible version of the model. Most of this improvement occurs
                              because imposing the stationary distribution on the root in the reversible
                              model is incompatible with the wide variation in DNA base proportions
                              in the contemporary species displayed in Table 10.2. Indeed, under the
                              generalized Kimura model with stationarity imposed, the maximum log-
                              likelihood of the best rooted tree falls to −4588.7. This best tree coincides


                                TABLE 10.2. Observed Base Proportions for the Four Contemporary Taxa
                                        A. salina   D. mobilis   H. morrhuae      B .subtilis
                                Base   Eukaryote    Eocycte    Halobacterium    Eubacterium
                                  A        .250        .232          .202            .255
                                  G        .319        .328          .367            .279
                                  C        .230        .263          .290            .234
                                  T        .202        .178          .141            .232