
Page 345 - Applied Probability
P. 345
15. Diffusion Processes
334
grown exponentially from 1000 founders to n 0 =5, 000, 000 contemporary
people over a span of 80 generations. Our hypothetical recessive disease has
−6
, fitness f =0.5, and a high initial gene frequency
mutation rate η =10
of 0.015. The slow deterministic decay to the equilibrium gene frequency
η/(1 − f)=0.0014 extends well beyond the present. Figure 15.1 plots
of
the density of the frequency of the recessive gene from generation 7 to
generation 80. The figure omits the first seven generations because the
densities in that time range are too concentrated for the remaining densities
to scale well. The left ridge of the gene density surface represents a moderate
probability mass collecting in the narrow region where the gene is either
extinct or in danger of going extinct.
0.0012
exact
q = 40
0.001
0.0008
Pr(X t = 0) 0.0006
0.0004
0.0002
0
0 10 20 30 40 50 60 70 80
generations t
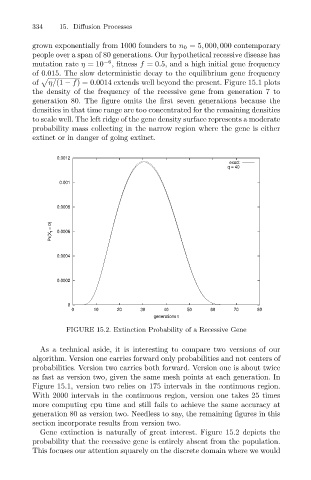
FIGURE 15.2. Extinction Probability of a Recessive Gene
As a technical aside, it is interesting to compare two versions of our
algorithm. Version one carries forward only probabilities and not centers of
probabilities. Version two carries both forward. Version one is about twice
as fast as version two, given the same mesh points at each generation. In
Figure 15.1, version two relies on 175 intervals in the continuous region.
With 2000 intervals in the continuous region, version one takes 25 times
more computing cpu time and still fails to achieve the same accuracy at
generation 80 as version two. Needless to say, the remaining figures in this
section incorporate results from version two.
Gene extinction is naturally of great interest. Figure 15.2 depicts the
probability that the recessive gene is entirely absent from the population.
This focuses our attention squarely on the discrete domain where we would