
Page 346 - Applied Probability
P. 346
15. Diffusion Processes
335
expect the diffusion approximation to deteriorate. The solid curve of the
graph shows the outcome of computing directly with the exact Wright-
Fisher chain. At about generation 60, the matrix times vector multiplica-
tions implicit in the Markov chain updates start to slow the computations
drastically. In this example, it took 14 minutes of computing time on a
desktop PC to reach 80 generations. When we used our new algorithm
with q = 40 intervals covering the discrete region and 500 intervals cover-
ing the continuous region, it took only 11 seconds to reach generation 80.
The resulting dashed curve is quite close to the solid curve in Figure 15.2,
and setting q = 50 makes it practically identical.
0.03
no bottleneck/mean
no bottleneck/mean +- 2 σ
bottleneck/mean
bottleneck/mean +- 2 σ
0.025
0.02
allele frequency X t 0.015
0.01
0.005
0
0 10 20 30 40 50 60 70 80
generations t
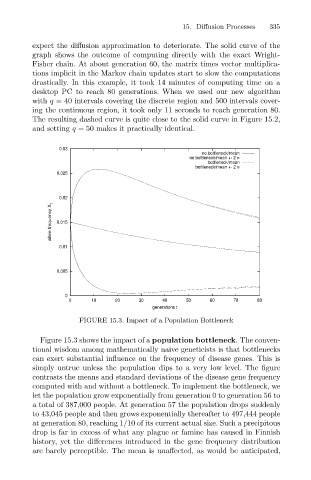
FIGURE 15.3. Impact of a Population Bottleneck
Figure 15.3 shows the impact of a population bottleneck. The conven-
tional wisdom among mathematically naive geneticists is that bottlenecks
can exert substantial influence on the frequency of disease genes. This is
simply untrue unless the population dips to a very low level. The figure
contrasts the means and standard deviations of the disease gene frequency
computed with and without a bottleneck. To implement the bottleneck, we
let the population grow exponentially from generation 0 to generation 56 to
a total of 387,000 people. At generation 57 the population drops suddenly
to 43,045 people and then grows exponentially thereafter to 497,444 people
at generation 80, reaching 1/10 of its current actual size. Such a precipitous
drop is far in excess of what any plague or famine has caused in Finnish
history, yet the differences introduced in the gene frequency distribution
are barely perceptible. The mean is unaffected, as would be anticipated,