Page 62 - Applied Probability
P. 62

30  40                 3. Newton’s Method and Scoring  45

                                    Information  20  o  o


                                            o
                                             o
                                              o
                                               o
                                       10       o  o  o o o o o o o o o o o o o o o o o o o o o o o o o o o o o o o o o o o oo oo ooo

                                       0
                                               0.1       0.2       0.3       0.4       0.5
                                                                Theta

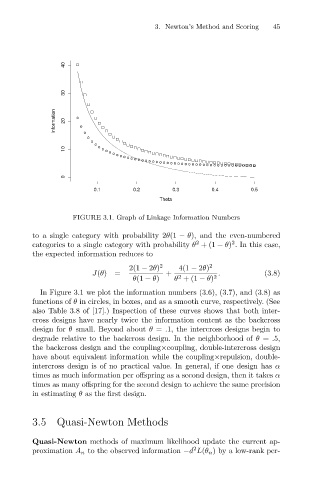
                                         FIGURE 3.1. Graph of Linkage Information Numbers

                              to a single category with probability 2θ(1 − θ), and the even-numbered
                                                                         2
                                                                                  2
                              categories to a single category with probability θ +(1 − θ) . In this case,
                              the expected information reduces to
                                                        2(1 − 2θ) 2  4(1 − 2θ) 2
                                              J(θ)  =            +             .           (3.8)
                                                                    2
                                                         θ(1 − θ)  θ +(1 − θ) 2
                                In Figure 3.1 we plot the information numbers (3.6), (3.7), and (3.8) as
                              functions of θ in circles, in boxes, and as a smooth curve, respectively. (See
                              also Table 3.8 of [17].) Inspection of these curves shows that both inter-
                              cross designs have nearly twice the information content as the backcross
                              design for θ small. Beyond about θ = .1, the intercross designs begin to
                              degrade relative to the backcross design. In the neighborhood of θ = .5,
                              the backcross design and the coupling×coupling, double-intercross design
                              have about equivalent information while the coupling×repulsion, double-
                              intercross design is of no practical value. In general, if one design has α
                              times as much information per offspring as a second design, then it takes α
                              times as many offspring for the second design to achieve the same precision
                              in estimating θ as the first design.


                              3.5 Quasi-Newton Methods


                              Quasi-Newton methods of maximum likelihood update the current ap-
                                                                        2
                              proximation A n to the observed information −d L(θ n ) by a low-rank per-
   57   58   59   60   61   62   63   64   65   66   67