
Page 15 - APPLIED PROCESS DESIGN FOR CHEMICAL AND PETROCHEMICAL PLANTS, Volume 1, 3rd Edition
P. 15
4 Applied Process Design for Chemical and Petrochemical Plants
Table 1-1 brittlement (see latest charts [54]). Another important
Typical Thickness Chart-Insulation for Services 70°F area is water service (see [49]). The engineer selecting the
through 1200°F Piping, Vessels & Equipment 36” materials of construction should recognize the impor-
Diameter & Smaller tance of plastics and plastic composites in the design of
industrial equipment and appreciate that plastics often
Pipe Insulation Thickness serve as better corrosive resistant materials than do metals.
size 1” 1 gu 2“ 2T 3“
2?4“ & Smaller 700°F 1000°F 1200°F Flowsheets-Types
3” 700 900 1100 1200°F
4” 700 900 1100 1200 The flowsheet is the “road-map’’ of a process, and
6” 600 800 1000 1200 serves to identi9 and focus the scope of the process for all
8” - 800 1000 1200
10” - 800 1000 1200 interested and associated functions of the project. As a
12“ - 800 1000 1200 project progresses, the various engineering disciplines
14” - 800 1000 1100 1200°F read their portions of responsibility from the flowsheet,
1 6” - 800 900 1100 1200 although they may not understand the process or other
18” - 800 900 1100 1200 details relative to some of the other phases of engineer-
20” - 800 900 1100 1200 ing. Here is where the process and/or project engineer
24” - 800 900 1100 1200 serves to tie together these necessary segments of work.
30” - 800 900 1100 1200 This often involves explanations sufficiently clear to
36” - 800 900 1000 1200 enable these other groups to obtain a good picture of the
Temperatures in chart are maximum operating temperatures in degrees objective and the problems associated with attaining it.
Fahrenheit for given thickness. The flowsheet also describes the process to manage-
Note: All hot insulated piping shall be coded, including piping insulated for
personnel protection. Thickness is a function of insulation composition. ment as well as those concerned with preparing econom-
ic studies for process evaluation.
A good process flowsheet pictorially and graphically
identifies the chemical process steps in proper sequence.
engineer must be interested in and conversant with the It is done in such a manner and with sufficient detail to
layout of the plant; the relationship of equipment for present to others a proper mechanical interpretation of
maintenance; the safety relationships of equipment in the the chemical requirements.
plant; the possibilities for fire and/or explosion; the pos-
sibilities for external fire on the equipment areas of the There are several types of flowsheets:
plant; the existence of hazardous conditions, including
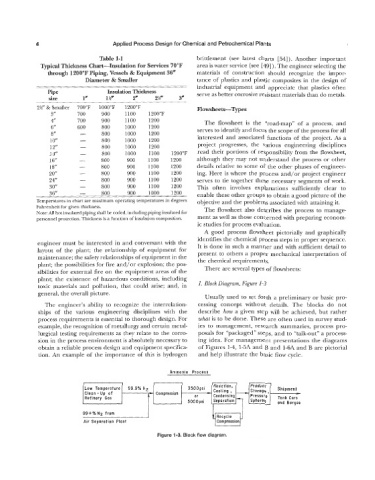
toxic materials and pollution, that could arise; and, in 1. Block Diagram, Figure 1-3
general, the overall picture.
Usually used to set forth a preliminary or basic pro-
The engineer’s ability to recognize the interrelation- cessing concept without details. The blocks do not
ships of the various engineering disciplines with the describe how a given step will be achieved, but rather
process requirements is essential to thorough design. For what is to be done. These are often used in survey stud-
example, the recognition of metallurgy and certain metal- ies to management, research summaries, process pro-
lurgical testing requirements as they relate to the corro- posals for “packaged” steps, and to “talk-out’’ a process-
sion in the process environment is absolutely necessary to ing idea. For management presentations the diagrams
obtain a reliable process design and equipment specifica- of Figures 1-4, 1-5A and B and 1-6A and B are pictorial
tion. An example of the importance of this is hydrogen and help illustrate the basic flow cycle.
Ammonia Process
Reaction,
Low Temperature 99.9% HZ 3500psi -Cooling , ---) Product Shipment -
storage,
Clean-up of . Compression -
Refinery Gas or Condensing Pressure Tank Cars
5000psi Separation Spheres and Barges
l-i
99+%N2 from
Recycle
Air Separation Plant Compression
Figure 1-3. Block flow diagram.