
Page 178 - APPLIED PROCESS DESIGN FOR CHEMICAL AND PETROCHEMICAL PLANTS, Volume 1, 3rd Edition
P. 178
Fluid Flow
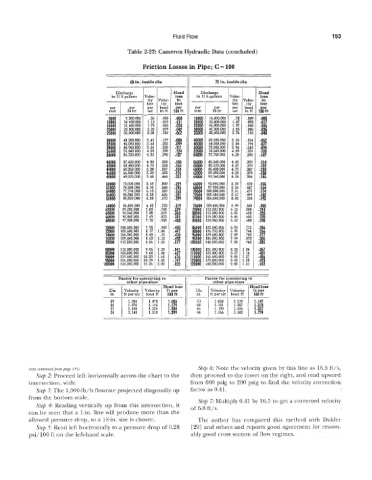
Table 2-22: Cameron Hydraulic Data (concluded)
Friction Losses in Pipe; C = 100
I1
6) in. inside dla
~- - 72 in. inside dia
- -
__ - ~
Discharge Head Discharge Head
in U S gallons
__ ?@lOC Ieloc loss - Veloc Veloc. loss
ity
in
in
ity
ity
feet head feet per Per feet head feet
ity
in it 1CX
Per
Per
per
F
mtn
in ft ICX
24 hr
- _- sec - min 24 hr sec __ -
~
6000 7.200,00( .5f .001 .003 1000( 14,400,000 .78 .009 .005
10000 14 400,00( 1.1: .01S 411 2000( 28,800,OiM 1.57 ,038 .017
16000 21,600.00( 1.7( .045 424 2600( 36,000,oW 1.97 .060 -026
20000 28,800.00( 2.2t .075 .042 3000( 43,200,000 2.36 ,086 -036
26000 36,000,00( 2.83 .I24 .a62 35001 50,400,000 2.76 .I18 0043
30000 43,200,OOC 3.40 .179 .oa 4ooom 57,600,000 3.16 .I54 .062
3!zooo 46,080,MIC 3.63 .205 .099 46000 64,800,000 3.54 ,194 .on
34000 48,960,oac 3.86 .m .111 60000 72,000,000 3.94 .240 .094
36000 51,840,000 4.09 .259 .124 6200(1 74,880,000 4.09 .259 .loo
38000 54,720,000 4.32 .29Q -137 54000 77,760,000 4.26 .280 -107
40000 57,600,000 4.55 .320 .160 66000 80,540,000 4.41 ,302 .114
42000 60,480,OW 4.78 .354 .164 68000 83,520,000 4.57 .324 .122
44000 63,360,000 5.00 .3a7 .180 60000 86,400,000 4.73 ,347 .130
46000 66,240,000 5.22 .422 ,196 62000 89,280,000 4.88 .. 370 .138
48000 69,020,000 5.46 .460 .212 64000 92,160,000 5.04 ,384 .146
60000 72,000.000 5.68 .500 .229 66000 95,040,000 5.20 ,420 .156
62000 74,880,000 5.90 .540 .246 68000 97,920,000 5.36 ,447 .164
64000 77,760,000 6.12 .582 .263 70000 00,800,000 5.51 ,473 .174
66000 80,540,000 6.35 .626 .281 72000 03,680.000 5.67 ,499 .183
68000 83,520,000 6.58 .672 .299 74000 06,560,000 5.83 ,528 .193
60000 E6 400 000 6.81 .720 .319 76000 09,440,000 5.99 ,558 .203
62000 a9:2so:ooo 7.03 ,168 .339 78000 13,320,000 6.15 .388 .214
64000 92,160,000 7.25 .819 360 80000 15,200,000 6.31 .620 .226
66000 95,040,000 7.49 .E70 18,080,000 6.46 ,650 .236
68000 97,920,000 7.72 .925 :I# 3881 20,960,000 6.62 .680 .2
70000 00,800,ooo 7.95 .980 .426 86000 23,840,000 6.78 .71P -266
%!I .04 47 88000 26,720,000 6.93 ,746 .266
03,680,000 8.17
29,600,000 7.09 ,780 277
*47Q
96000
06,560,000 8.40 .IO
76000 09,440,000 8.62 .15 .493 95000 36,800,000 7.49 .870 .306
78000 12,320,000 8.86 .22 417 100000 44,000,000 7.88 .965
BOW0 15,200,000 9.06 .28 341 106000 51,200,000 8.28 1.06 0367
85000 22,400,000 9.64 .44 .607 110000 5R,400,000 8.67 1.16 .401
90000 29,600,000 0.20 .61 .676 116000 69,600,000 9.05 L.27 -436
96000 36 800 000 0.78 .80 .747 120000 9.45 1.38 .4n
100000 44:OOO:OOO 1.36 . 00 422 125000 9.85 1.51 .6t4
Headloss 11
__ - - -
Factor for correcting to Factor for correcting to
other pipe sizes other pipe sizes
Head loas
via I velocity 1 Velocity 1 ftper Dia 1 Velocity I Velocity 1 ftper
in ftuersec head ft lOOft in ftpersec head ft 1BOf.t
(text contznuedfrom page 141) Step 6: Note the velocity given by this line as 16.5 ft/s,
Step 2: Proceed left horizontally across the chart to the then proceed to the insert on the right, and read upward
intersection, with: from 600 psig to 200 psig to find the velocity correction
Step 3: The 1,000-lb/h flowrate projected diagonally up factor as 0.41.
from the bottom scale. Step 7: Multiply 0.41 by 16.5 to get a corrected velocity
Step 4: Reading vertically up from this intersection, it of 6.8 ft/s.
can be seen that a 1-in. line will produce more than the
allowed pressure drop, so a %in. size is chosen. The author has compared this method with Dukler
Step 4: Read left horizontally to a pressure drop of 0.28 [29] and others and reports good agreement for reason-
psi/lOO ft on the left-hand scale. ably good cross section of flow regimes.