
Page 56 - Applied Process Design For Chemical And Petrochemical Plants Volume II
P. 56
Distillation 45
This suggests that caution must be exercised when estab-
lishing a tray efficiency for any type contacting device by (1)
using actual test data if available for some similar system or
(2) comparing several methods of predicting efficiency, 2.5 .
and (3) possible use of a more conservative efficiency than
calculated to avoid the possibility of ending up with a com-
plete column with too few actual trays-a disastrous situa- -
‘MV
tion if not discovered prior to start-up operations. EOG
Sakata [180] evaluates the degree of mixing of the liq-
uid as it flows across a tray and its effect on the tray effi-
ciency, Figure 8-30. For plug flow the liquid flows across
the tray with no mixing, while for partial or “spot” mixing
as it flows over the tray, an improved tray efficiency can be
expected. For a completely mixed tray liquid, the point
I
efficiency for a small element of the tray, EOG, and tray PERFECTLY 3 5 7 9 II 13
efficiency, EMV, are equal. MIXED NUMBER OF MIXING POOLS, n
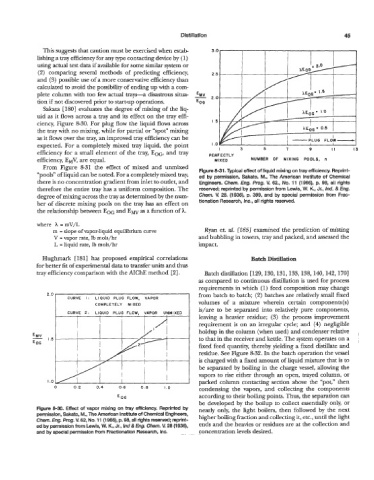
From Figure 8-31 the effect of mixed and unmixed
Figure 8-31. Typical effect of liquid mixing on tray efficiency. Reprint-
“pools” of liquid can be noted. For a completely mixed tray, ed by permission, Sakato, M., The American Institute of Chemical
there is no concentration gradient from inlet to outlet, and Engineers. Chem. Eng. Pmg- V. 62., No. 11 (1966), p. 98, all rights
therefore the entire tray has a uniform composition. The reserved; reprinted by permission from Lewis, W. K., Jr., Ind. & Eng.
degree of mixing across the tray as determined by the num- Chem. V. 28. (1936), p. 399, and by special permission from Frac-
ber of discrete mixing pools on the tray has an effect on tionation Research, Inc., all rights resewed.
the relationship between EOG and Ew as a function of A.
where h = mV/L
m = slope of vapor-liquid equilibrium curve Ryan et. al. [185] examined the prediction of misting
V = vapor rate, lb mols/hr and bubbling in towers, tray and packed, and assessed the
L = liquid rate, lb mols/hr impact.
Hughmark [ 1811 has proposed empirical correlations Batch Distillation
for better fit of experimental data to transfer units and thus
tray efficiency comparison with the AIChE method [2]. Batch distillation [129, 130, 131, 133, 138, 140,142, 1701
as compared to continuous distillation is used for process
requirements in which (1) feed composition may change
from batch to batch; (2) batches are relatively small fixed
CURVE I: LIQUID PLUG FLOW, VAPOR
COMPLETELY MIXED volumes of a mixture wherein certain components(s)
is/are to be separated into relatively pure components,
CURVE 2: LIQUID PLUG FLOW, VAPOR UNMIXED
leaving a heavier residue; (3) the process improvement
requirement is on an irregular cycle; and (4) negligible
holdup in the column (when used) and condenser relative
- to that in the receiver and kettle. The system operates on a
EMV
EOG
fixed feed quantity, thereby yielding a fixed distillate and
residue. See Figure 8-32. In the batch operation the vessel
is charged with a fixed amount of liquid mixture that is to
be separated by boiling in the charge vessel, allowing the
vapors to rise either through an open, trayed column, or
packed column contacting section above the ‘‘pot,” then
0 0.2 0.4 0.6 0.8 1.0 condensing the vapors, and collecting the components
E OG according to their boiling points. Thus, the separation can
be developed by the boilup to collect essentially only, or
Figure 8-30. Effect of vapor mixing on tray Mciency. Reprinted by nearly only, the light boilers, then followed by the next
permission, Sakato, M., The American Institute of Chemical Engineers, higher boiling fraction and collecting it, etc., until the light
Chem. Eng. Pmg. V. 62, No. 11 (1 966), p. 98, all rights resewed; reprint-
ed by permission from Lewis, W. K., Jr., Ind & Eng. Chem. V. 28 (1 936), ends and the heavies or residues are at the collection and
and by special permission from Fractionation Research, Inc. concentration levels desired.