
Page 51 - Applied Process Design For Chemical And Petrochemical Plants Volume II
P. 51
40 Applied Process Design for Chemical and Petrochemical Plants
Actual Conservative
Reflux (From Add 1
Ratio (L/D) - (L/D)a Fig. &24A) N For Feed,
L/D+l N-Nh (Theo.) TotalN
0.772 0.0722 0.552 26.2 27
1.16 0.239 0.416 19.8 21
1.45 0.329 0.356 17.9 19
1.93 0.439 0.288 16.1 17
(L/D) - (L/D),in 0.772 - 0.644 = 0.0722
(L/D)+ 1 0.772 + 1
Read value from curve Figure 8-24A.
- Nmin = 0.552
N+l
N - 11.18 = 0.552
N+l
N = 26.2
Note that these values for theoretical trays do not contain
corrections in overall efficiency, and hence are not the
actual trays for the binary distillation column. Efficiencies
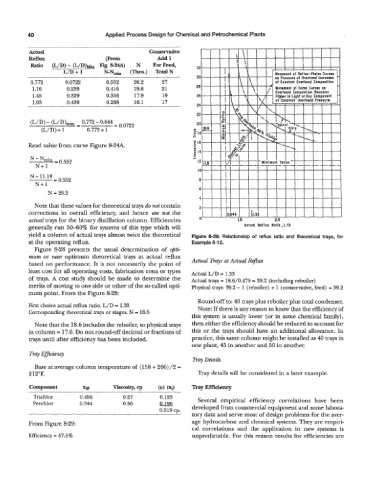
generally run 50-60% for systems of this type which will Actual Reflux Ratio, LID
yield a column of actual trays almost twice the theoretical Figure 8-28. Relationship of reflux ratio and theoretical trays, for
at the operating reflux. Example 8-1 2.
Figure 8-28 presents the usual determination of opti-
mum or near optimum theoretical trays at actual reflux
based on performance. It is not necessarily the point of Actual Trays at Actual Rejlw
least cost for all operating costs, fabrication costs or types Actual L/D = 1.33
of trays. A cost study should be made to determine the Actual trays = 18.6/0.475 = 39.2 (including reboiler)
merits of moving to one side or other of the so-called opti- Physical trays: 39.2 - 1 (reboiler) + 1 (conservative, feed) = 39.2
mum point. From the Figure 8-28:
Round-off to: 40 trays plus reboiler plus total condenser.
First choice actual reflux ratio, L/D = 1.33
Corresponding theoretical trays or stages, N = 18.6 Note: If there is any reason to know that the efficiency of
this system is usually lower (or in same chemical family),
Note that the 18.6 includes the reboiler, so physical trays then either the efficiency should be reduced to account for
in column = 17.6. Do not round-off decimal or fractions of this or the trays should have an additional allowance. In
trays until after efficiency has been included. practice, this same column might be installed as 40 trays in
one plant, 45 in another and 50 in another.
Traj Efficieng
Tray Details
Base at average column temperature of (158 + 266) /2 =
212°F. Tray details will be considered in a later example.
Tray Efficiency
Trichlor 0.456 0.27 0.123 Several empirical efficiency correlations have been
Perchlor 0.544 0.36 0,196
0.319 cp. developed from commercial equipment and some labora-
tory data and serve most of design problems for the aver-
From Figure 8-29: age hydrocarbon and chemical systems. They are empiri-
cal correlations and the application in new systems is
Efficiency = 47.5% unpredictable. For this reason results for efficiencies are