Page 46 - Applied Process Design For Chemical And Petrochemical Plants Volume II
P. 46

Distillation                                          35

             )If-  6 = 1.35 (.15) - .01736 = 0.186
             Xf- 6= 0.092                                          Substituting, slope = - - -+3
                                                                                    -1.5
                                                                                           -1.5
                                                                                               -
                                                                                         =
             yf- 7= 1.35 (.092) - .01736 = 0.107                                   1- 1.5  - 0.5
             xf-  7= 0.05  (The desired bottoms composition)
             Total theoretical trays:                                Referring  to  calculations  of  Example  8-10,  for  an
                                                                   equimolal mixture of benzene and toluene in feed:
             rectifylng section = 4
             feed tray     =1                                      overhead product, D = 50 mols/100 mols feed
             stripping section = 7
             total         = 12 Trays                              calculate  ($)    =-, XD - Yc
             Example: 81 1 Thermal Condition of Feed                             min   YC  -XC

               Using the same operating reflux  (same fraction times   where XD = 0.95
             the minimum) as was used in Example 8-10, calculate the    yc = 0.774”
             theoretical plates required for feed of the following ther-   xC  = 0.59*
             mal conditions: Use Figure 8-27.                              - 0.95 - 0.774
                                                                           -
             (a) q = 1.5                                                    0.774-  0.59
             (b) q = 0                                                      0.176
             (c) q = -1.5                                                  =-  0.184

            A. Fmq = 1.5                                           (L/D)min = (LR/D)~~~ 0.956 min. reflux ratio,
                                                                                     =
                                                                                       reflux/produc  t
              Slope of “q” line = -q/l  - q
                                                                   *Read from graph at intersection of =q” line for 1 .?i and minimum reflux
                                                                   operating line.
                                         Equilibrium  Curve,
                                                                   Slope of Operating Line at Min. Rejlux:

                                                                                   L/D     0.956   o.49
                                                                   (3 =(?)min   =L/D=.956+1=

                                                                     (Graph reads 0.59 but this depends much on accuracy
                                                                   of plot.)

                                                                   calculating

                                                                   (+)     XD -Yc
                                                                      min   =-  XD -x~
                                                                         -  -  .95 - .774  = 0.49
                                                                           .95  - 39

                                                                   Actual Operating Line:

                                                                     Operating reflux ratio = (1.5) (L/D)  = 1.5 (0.956)
                                                                                        = 1.432 reflux/product

                                                                    Slope of actual operating line:

                                                                   L
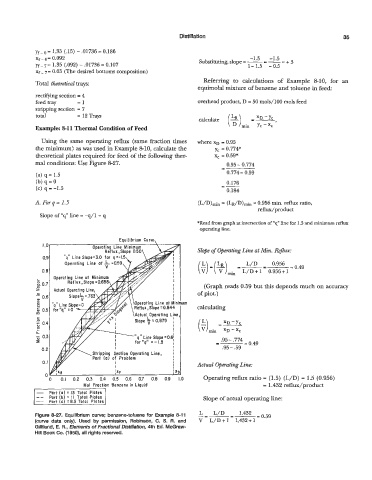
            Figure 8-27.  Equilibrium curve; benzene-toluene for  Example 8-1 1   _=--   L/D   --=   1.432   o.5g
            (curve  data  only).  Used  by  permission,  Robinson, C.  S.  R. and   V  L/D+l  1,432+1
            Gilliland, E. R., Elements of Fractional Distillation, 4th Ed. McGraw-
            Hill Book Co. (1950), all rights reserved.
   41   42   43   44   45   46   47   48   49   50   51