
Page 41 - Applied Process Design For Chemical And Petrochemical Plants Volume II
P. 41
30 Applied Process Design for Chemical and Petrochemical Plants
Bubble Point Liquid, q = 1.0 Many systems appear to be economically designed for
(L/D)- (L'D)min = 0.1 to 0.33 and using actual reflux ratios
(8 - 55) (L/D) + 1
of 1.2 to 1.5 times the ratio at minimum reflux. For systems
All vapor feed, no superheating, q = 0 of greatly varying relative volatility this should not be used;
instead, a Ponchon or enthalpy method must be followed.
Eduljee [84] suggests an equation to replace the
(8 - 56)
Gilliland plot as easier to use. The data input must be the
same. For tray towers:
For the general case the relation is more complex in
order to solve for (L/D)min. YT = 0.75 - 0.75X0.5668 (8 - 58)
(8 - 39)
(8 - 60)
Short et al. [230j discuss minimum reflux for complex where S, = theoretical actual trays at actual reflux, L/D,
fractionators. including overhead total condenser and reboiler
YT = correlation expression similar to Gdliland's
X = correlation expression similar to Gilliland's
Theoretical Trays at Actual Reflux R = reflux ratio, L/D where L is liquid returned to
the column in mols/hr
D = distillate rate in mols/hr
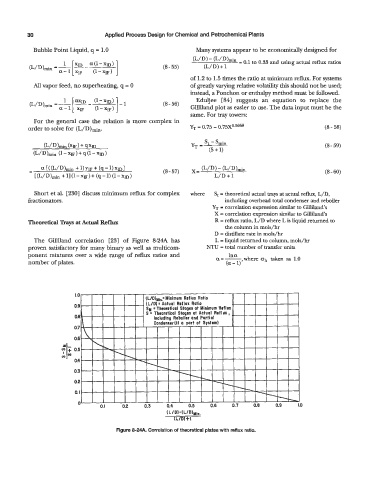
The Gilliland correlation [23] of Figure 8-24A has L = liquid returned to column, mols/hr
proven satisfactory for many binary as well as multicom- NTU = total number of transfer units
ponent mixtures over a wide range of reflux ratios and a=- In a ,where ah taken as 1.0
number of plates. (a - 1)
(L/D)-(L/D)y,,,
(L/DI+I
Figure 8-MA. Correlation of theoretical plates with reflux ratio.