
Page 43 - Applied Process Design For Chemical And Petrochemical Plants Volume II
P. 43
32 Applied Process Design for Chemical and Petrochemical Plants
a quick evaluation of Gilliland’s equation for theoretical
plates at any reflux and minimum theoretical plates and
minimum reflux ratio. The accuracy appears to satisfy
industrial design needs, therefore it can be time saving
when evaluating a range of values. For another interesting
attempt to improve the Gilliland plot by use of equations,
see Reference 136.
Example 8-9: Using Figure 824B to Solve Gilliland’s
Equation for Determining Minimum Theoretical Plates
for Setting Actual Reflux (used by permission [1221)
If the minimum reflux ratio is 2.0 and the minimum
number of theoretical plates is 20, how many plates will be
required if a reflux ratio 1.5 times the minimum is used?
Solution. The required reflux ratio, R = 1.5 x 2.0 = 3.0
1. Connect 2.0 on left hand Rmin scale with 3.0 on left
diagonal R scale and extend to cut Tie Line 1.
2. Transfer this value across the central maze to Tie
Line 2. liquid Phase Canposition
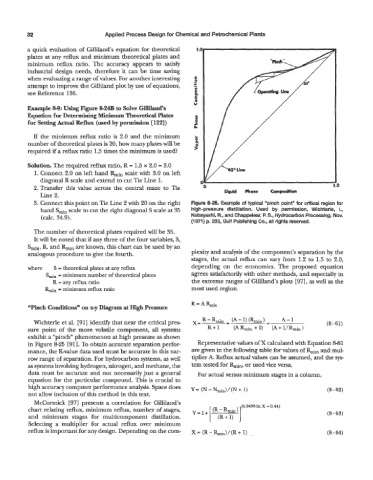
3. Connect this point on Tie Line 2 with 20 on the right Figure 8-25, Example of typical “pinch point” for critical region for
hand hin scale to cut the right diagonal S scale at 35 high-pressure distillation. Used by permission, Wichterle, I.,
(calc. 34.9). Kobayashi, R., and Chappelear, P. S., Hydrocarbon Processing, Nov.
(1971) p. 233, Gulf Publishing Co., all rights reserved.
The number of theoretical plates required will be 35.
It will be noted that if any three of the four variables, S,
Smin, R, and Rmin are known, this chart can be used by an
analogous procedure to give the fourth. plexity and analysis of the component’s separation by the
stages, the actual reflux can vary from 1.2 to 1.5 to 2.0,
where S = theoretical plates at any reflux depending on the economics. The proposed equation
Smin = minimum number of theoretical plates agrees satisfactorily with other methods, and especially in
R = any reflux ratio the extreme ranges of Gilliland’s plots [9’7], as well as the
Rmin = minimum reflux ratio most used region.
R=Aki,
‘‘Pinch Conditions” on x-y Diagram at High Pressure
Wichterle et al. [91] identify that near the critical pres-
sure point of the more volatile component, all systems
exhibit a “pinch” phenomenon at high pressure as shown
in Figure 8-25 [91]. To obtain accurate separation perfor- Representative values of X calculated with Equation 8-61
mance, the K-value data used must be accurate in this nar- are given in the following table for values of Rfin and mul-
row range of separation. For hydrocarbon systems, as well tiplier A. Reflux actual values can be assumed, and the sp
as systems involving hydrogen, nitrogen, and methane, the tem tested for Rmin, or used vice versa.
data must be accurate and not necessarily just a general For actual versus minimum stages in a column,
equation for the particular compound. This is crucial to
high accuracy computer performance analysis. Space does Y (N - Nmh)/(N + 1) (8 - 62)
not allow inclusion of this method in this text.
McCormick [97] presents a correlation for Gilliland’s Y=l+[ (R - Rmin 1 ]
chart relating reflux, minimum reflux, number of stages, (0.0456 In X + 0.44)
and minimum stages for multicomponent distillation. (R + 1) (8 - 63)
Selecting a multiplier for actual reflux over minimum
reflux is important for any design. Depending on the com-