Page 40 - Applied Process Design For Chemical And Petrochemical Plants Volume II
P. 40

Distillation                                           29

             where  ct = relative volatility between the two components in   1.c
                       the temperature range Tbl to Tb2
                  Tbl = normal boiling point of Component 1,”K           ‘I
                                                                      -
                  Tb2 = normal boiling point of  Component 2, “K     *
                   L1= latent heat of vaporization for Component 1 at   c
                                                                     Q
                                                                     I
                                                                     0
                       Tbl, kcal/kmole                               n
                   L2 = latent heat of vaporization for Component 2 at   L
                                                                     0
                       Tb2, kcal/kmole                               3
                                                                     .^
                                                                     c
                                                                     e
               If a compound’s latent heat is not known, it can be esti-   c
                                                                     Q
                                                                     c
                                                                     0
             mated  from  the  normal  boiling  points  and  molecular   0
                                                                     E
                                                                     -
                                                                     0
             weight.                                                 0                                         I  I
                                                                     c                                         I
                                                                     .-                                        I  I
                                                                     D
             Example 8-8: Relative Volatility Estimate by Wagle’s    -1                                        I  I
                                                                     0  .-
                                                                     E
             Method [92] (used by permission)                        c                                         I
                                                                     V                                         I
                                                                     LL
               The average relative volatility of benzene and toluene   -
             can be determined using the following data: Tbb = 353.3   r”
             K, Tbt  = 383.8 K,  Lb  = 7,352 kcal/kmole,  and L,  = ’1,930                                     I
             kcal/kmole  (where the subscripts b and t denote benzene                                          I  I
             and toluene, respectively). Substituting these values into   0                                       1.0
             Equation 8-52 above, we find that:                            Mol  Froetion  Light  Cumponent in Liquid  Phase,  x
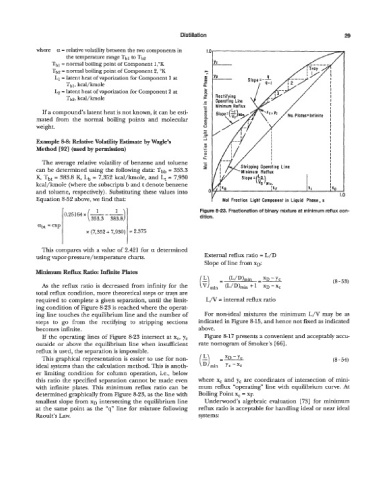
                                                                    Figure 8-23. Fractionation of binary mixture at minimum reflux con-
                                                                    dition.
              abt = exp
                              x (7,332+ 7,930)  = 2.375
               This compares with a value of 2.421 for a determined
             using vapor-pressure/ temperature charts.               External reflux ratio = L/D
                                                                     Slope of line from XD:
             Minimum Reflux Ratio: Infiiite Plates
               As the  reflux  ratio is  decreased from infinity for  the
             total reflux condition, more theoretical steps or trays are
             required to complete a given separation, until the limit-   L/V  = internal reflux ratio
             ing condition of Figure 8-23 is reached where the operat-
             ing line touches the equilibrium line and the number of   For non-ideal mixtures the minimum L/V  may  be  as
             steps  to  go  from  the  rectifjmg  to  stripping  sections   indicated in Figure 8-15, and hence not fEed as indicated
             becomes infinite.                                     above.
               If  the operating lines of  Figure 8-23 intersect at x,,  yc   Figure 8-17 presents a convenient and acceptably accu-
             outside or above the  equilibrium line when  insufficient   rate nomogram of Smoker’s [66].
             reflux is used, the separation is impossible.
               This graphical representation is easier to use for non-
             ideal systems than the calculation method. This is anoth-
             er limiting condition for  column  operation, i.e.,  below
             this ratio the specified separation cannot be made even   where xc and yc  are coordinates of  intersection of mini-
             with  infinite plates.  This  minimum  reflux  ratio can  be   mum reflux “operating” line with  equilibrium curve. At
             determined graphically from Figure 8-23, as the line with   Boiling Point xc = xp
             smallest slope from XD  intersecting the equilibrium line   Underwood’s algebraic evaluation  [ 731  for minimum
             at the same point as the  “q” line for mixture following   reflux ratio is acceptable for handling ideal or near ideal
             Raoult’s Law.                                         sys tems:
   35   36   37   38   39   40   41   42   43   44   45