Page 37 - Applied Process Design For Chemical And Petrochemical Plants Volume II
P. 37

26                        Applied Process Design for Chemical and Petrochemical Plants

                                                                    1 .o

                                                                    0.9
           By assuming values of xl, the corresponding y1 may be cal-   0.8
           culated.
             For hydrocarbon systems, where & = yi/xi,  then,       0.7
                                                                d
                                                                0
                                                                %
                                                                2  0.6
                                                                W
           q,r = KdK, = relative volatility            (8- 36A)  R
                                                                I
                                                                    0.5
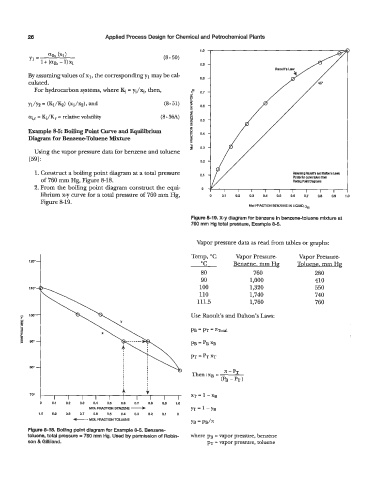
           Example 8-5: Boiling Point Curve and Equilibrium     z   0.4
                                                                9
           Diagram for Benzene-Toluene Mixture                  5
                                                                E
                                                                    0.3
             Using the vapor pressure data for benzene and toluene
           [59] :                                                   0.2
             1. Construct a boiling point diagram at a total pressure   0.1
               of 760 mm Hg, Figure 8-18.
             2. From the boiling point diagram construct the equi-   0
               librium x-y curve for a total pressure of 760 mm Hg,    0   0.1   0.2   0.3   0.4   0.5   0.6   0.7   0.8   0.9   1.0
               Figure 8-19.
                                                                                    Mol FRACTION BENZENE IN LIQUID, xB

                                                                 Figure 8-19. X-y diagram for benzene in benzene-toluene mixture at
                                                                 760 mm Hg total pressure, Example 8-5.


                                                                   Vapor pressure data as read from tables or graphs:
           '"1                                                   Temp, "C      Benzene. mm Hg       Toluene, mm Hg
                                                                                Vapor Pressure-
                                                                                                     Vapor Pressure-
                                                                    "C
                                                                                      760
                                                                    80
                                                                                                          280
                                                                                    1,000
                                                                    90
                                                                                                          550
                                                                    100             1,320                 410
                                                                    110             1,740                 '740
                                                                   111.5            1,760                 760
                                                                 Use Raoult's and Dalton's Laws:


                                                  v
           70"                                                   XT= 1 -XB
                   I    I   I    I   I    I             I   I
              0   0.1   0.2   0.3   0.4   0.5   0.6   0.7   0.8   0.9   1.0
                               MOL FRACTION BENZENE
              1.0   0.9   0.8   0.7   0.6   0.5   0.4   0.3   0.2   0.1   0
                         f--- MOL FRACTION TOLUENE
          Figure 8-18. Boiling point diagram for Example 8-5. Benzene-
          toluene, total pressure = 760 mm Hg. Used by permission of Robin-   where PB = vapor pressure, benzene
          son & Gilliland.                                            PT  = vapor pressure, toluene
   32   33   34   35   36   37   38   39   40   41   42