
Page 109 - Applied Statistics And Probability For Engineers
P. 109
PQ220 6234F.Ch 03 13/04/2002 03:19 PM Page 87
3-8 HYPERGEOMETRIC DISTRIBUTION 87
and
V1X2 411 3212 3231300 42 2994 0.88
For a hypergeometric random variable, E1X2 is similar to the mean a binomial random
variable. Also, V1X2 differs from the result for a binomial random variable only by the term
shown below.
Finite
Population The term in the variance of a hypergeometric random variable
Correction
Factor
N n
N 1
is called the finite population correction factor.
Sampling with replacement is equivalent to sampling from an infinite set because the propor-
tion of success remains constant for every trial in the experiment. As mentioned previously, if
sampling were done with replacement, X would be a binomial random variable and its vari-
ance would be np(1 p). Consequently, the finite population correction represents the cor-
rection to the binomial variance that results because the sampling is without replacement from
the finite set of size N.
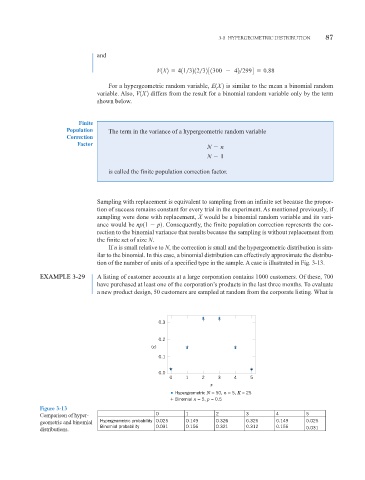
If n is small relative to N, the correction is small and the hypergeometric distribution is sim-
ilar to the binomial. In this case, a binomial distribution can effectively approximate the distribu-
tion of the number of units of a specified type in the sample. A case is illustrated in Fig. 3-13.
EXAMPLE 3-29 A listing of customer accounts at a large corporation contains 1000 customers. Of these, 700
have purchased at least one of the corporation’s products in the last three months. To evaluate
a new product design, 50 customers are sampled at random from the corporate listing. What is
0.3
0.2
(x)
0.1
0.0
0 1 2 3 4 5
x
Hypergeometric N = 50, n = 5, K = 25
Binomial n = 5, p = 0.5
Figure 3-13
Comparison of hyper- 0 1 2 3 4 5
geometric and binomial Hypergeometric probability 0.025 0.149 0.326 0.326 0.149 0.025
distributions. Binomial probability 0.031 0.156 0.321 0.312 0.156 0.031