
Page 122 - Applied Statistics And Probability For Engineers
P. 122
c04.qxd 5/10/02 5:19 PM Page 100 RK UL 6 RK UL 6:Desktop Folder:TEMP WORK:MONTGOMERY:REVISES UPLO D CH114 FIN L:Quark Files:
100 CHAPTER 4 CONTINUOUS RANDOM VARIABLES AND PROBABILITY DISTRIBUTIONS
f (x)
f (x)
0.05
x 0 10 20 x
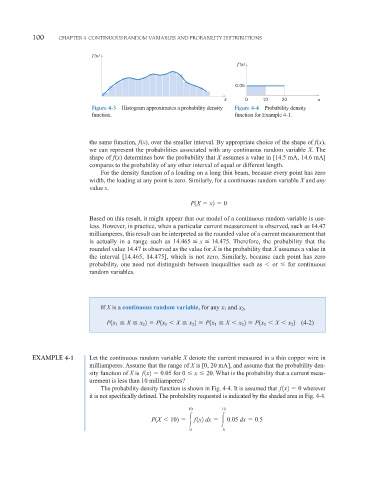
Figure 4-3 Histogram approximates a probability density Figure 4-4 Probability density
function. function for Example 4-1.
the same function, f(x), over the smaller interval. By appropriate choice of the shape of f(x),
we can represent the probabilities associated with any continuous random variable X. The
shape of f(x) determines how the probability that X assumes a value in [14.5 mA, 14.6 mA]
compares to the probability of any other interval of equal or different length.
For the density function of a loading on a long thin beam, because every point has zero
width, the loading at any point is zero. Similarly, for a continuous random variable X and any
value x.
P1X x2 0
Based on this result, it might appear that our model of a continuous random variable is use-
less. However, in practice, when a particular current measurement is observed, such as 14.47
milliamperes, this result can be interpreted as the rounded value of a current measurement that
is actually in a range such as 14.465 x 14.475. Therefore, the probability that the
rounded value 14.47 is observed as the value for X is the probability that X assumes a value in
the interval [14.465, 14.475], which is not zero. Similarly, because each point has zero
probability, one need not distinguish between inequalities such as or for continuous
random variables.
If X is a continuous random variable, for any x 1 and x ,
2
P1x X x 2 P1x X x 2 P1x X x 2 P1x X x 2 (4-2)
1
1
2
2
2
1
2
1
EXAMPLE 4-1 Let the continuous random variable X denote the current measured in a thin copper wire in
milliamperes. Assume that the range of X is [0, 20 mA], and assume that the probability den-
sity function of X is f 1x2 0.05 for 0 x 20. What is the probability that a current meas-
urement is less than 10 milliamperes?
The probability density function is shown in Fig. 4-4. It is assumed that f 1x2 0 wherever
it is not specifically defined. The probability requested is indicated by the shaded area in Fig. 4-4.
10 10
P1X 102 f 1x2 dx 0.05 dx 0.5
0 0