Page 125 - Applied Statistics And Probability For Engineers
P. 125

c04.qxd  5/10/02  5:19 PM  Page 103 RK UL 6 RK UL 6:Desktop Folder:TEMP WORK:MONTGOMERY:REVISES UPLO D CH114 FIN L:Quark Files:


                                                                   4-3 CUMULATIVE DISTRIBUTION FUNCTIONS  103


                                   and
                                                            x

                                                      F1x2    f 1u2 du   0.05x,  for  0   x   20

                                                            0
                                   Finally,
                                                                x

                                                         F1x2     f 1u2 du   1,  for  20   x

                                                                0
                                   Therefore,

                                                                    0           x   0
                                                            F1x2   •0.05x   0   x   20
                                                                    1      20   x

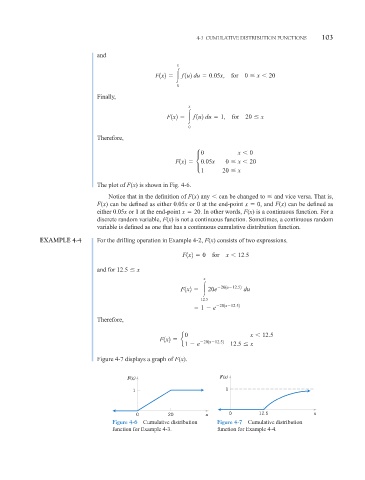
                                   The plot of F(x) is shown in Fig. 4-6.
                                       Notice that in the definition of F(x) any    can be changed to    and vice versa. That is,
                                   F(x) can be defined as either 0.05x or 0 at the end-point x   0,  and F(x) can be defined as
                                   either 0.05x or 1 at the end-point x   20.  In other words, F(x) is a continuous function. For a
                                   discrete random variable, F(x) is not a continuous function. Sometimes, a continuous random
                                   variable is defined as one that has a continuous cumulative distribution function.

                 EXAMPLE 4-4       For the drilling operation in Example 4-2, F(x) consists of two expressions.

                                                              F1x2   0  for  x   12.5

                                   and for 12.5   x
                                                                     x

                                                                F1x2    20e  201u 12.52   du
                                                                    12.5
                                                                    1   e  201x 12.52

                                   Therefore,

                                                               0                    x   12.5
                                                       F1x2   e      201x 12.52
                                                               1   e         12.5   x
                                   Figure 4-7 displays a graph of F(x).


                                             F(x)                         F(x)

                                              1                             1


                                               0          20          x      0        12.5              x
                                        Figure 4-6 Cumulative distribution  Figure 4-7  Cumulative distribution
                                        function for Example 4-3.        function for Example 4-4.
   120   121   122   123   124   125   126   127   128   129   130