
Page 183 - Applied Statistics And Probability For Engineers
P. 183
c05.qxd 5/13/02 1:49 PM Page 159 RK UL 6 RK UL 6:Desktop Folder:TEMP WORK:MONTGOMERY:REVISES UPLO D CH114 FIN L:Quark Files:
5-3 TWO CONTINUOUS RANDOM VARIABLES 159
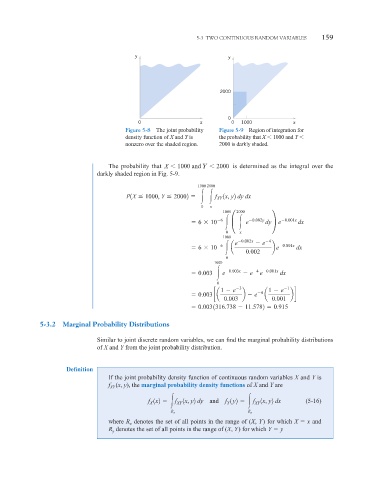
y y
2000
0
0 x 0 1000 x
Figure 5-8 The joint probability Figure 5-9 Region of integration for
density function of X and Y is the probability that X 1000 and Y
nonzero over the shaded region. 2000 is darkly shaded.
The probability that X 1000 and Y 2000 is determined as the integral over the
darkly shaded region in Fig. 5-9.
1000 2000
P1X 1000, Y 20002 XY 1x, y2 dy dx
f
0 x
1000 2000
0.002y 0.001x
6
6 10 ° e dy¢ e dx
0 x
1000 0.002x 4
e e 0.001x
6
6 10 a 0.002 b e dx
0
1000
0.003x 4 0.001x
0.003 e e e dx
0
1 e 3 4 1 e 1
0.003 ca b e a bd
0.003 0.001
0.003 1316.738 11.5782 0.915
5-3.2 Marginal Probability Distributions
Similar to joint discrete random variables, we can find the marginal probability distributions
of X and Y from the joint probability distribution.
Definition
If the joint probability density function of continuous random variables X and Y is
f (x, y), the marginal probability density functions of X and Y are
XY
f X 1x2 XY 1x, y2 dy and f Y 1y2 XY 1x, y2 dx (5-16)
f
f
R x R y
denotes the set of all points in the range of (X, Y) for which X x and
where R x
R denotes the set of all points in the range of (X, Y) for which Y y
y