
Page 231 - Applied Statistics And Probability For Engineers
P. 231
c06.qxd 5/14/02 9:54 M Page 192 RK UL 6 RK UL 6:Desktop Folder:TEMP WORK:MONTGOMERY:REVISES UPLO D CH114 FIN L:Quark Files:
192 CHAPTER 6 RANDOM SAMPLING AND DATA DESCRIPTION
x
12 13 14 15
x x
2 8
x 1 x 3
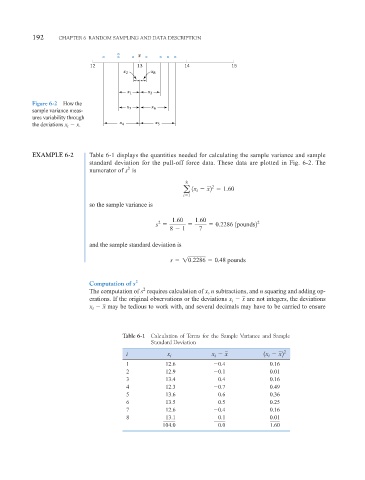
Figure 6-2 How the
x 7 x 6
sample variance meas-
ures variability through
the deviations x i x . x 4 x 5
EXAMPLE 6-2 Table 6-1 displays the quantities needed for calculating the sample variance and sample
standard deviation for the pull-off force data. These data are plotted in Fig. 6-2. The
numerator of s 2 is
8
a 1x x2 1.60
2
i
i 1
so the sample variance is
1.60 1.60
2
s 0.2286 1pounds2 2
8 1 7
and the sample standard deviation is
s 10.2286 0.48 pounds
Computation of s 2
2
s
x
The computation of requires calculation of , n subtractions, and n squaring and adding op-
erations. If the original observations or the deviations x i x are not integers, the deviations
x i x may be tedious to work with, and several decimals may have to be carried to ensure
Table 6-1 Calculation of Terms for the Sample Variance and Sample
Standard Deviation
i x i x x 1x x2 2
i
i
1 12.6 0.4 0.16
2 12.9 0.1 0.01
3 13.4 0.4 0.16
4 12.3 0.7 0.49
5 13.6 0.6 0.36
6 13.5 0.5 0.25
7 12.6 0.4 0.16
8 13.1 0.1 0.01
104.0 0.0 1.60