
Page 235 - Applied Statistics And Probability For Engineers
P. 235
c06.qxd 5/14/02 9:54 M Page 196 RK UL 6 RK UL 6:Desktop Folder:TEMP WORK:MONTGOMERY:REVISES UPLO D CH114 FIN L:Quark Files:
196 CHAPTER 6 RANDOM SAMPLING AND DATA DESCRIPTION
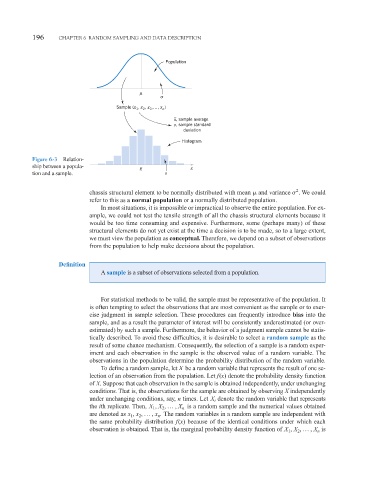
Population
µ
σ
, x , x ,…, x )
Sample (x 1 2 3 n
x, sample average
s, sample standard
deviation
Histogram
Figure 6-3 Relation-
ship between a popula-
x x
tion and a sample. s
chassis structural element to be normally distributed with mean and variance 2 . We could
refer to this as a normal population or a normally distributed population.
In most situations, it is impossible or impractical to observe the entire population. For ex-
ample, we could not test the tensile strength of all the chassis structural elements because it
would be too time consuming and expensive. Furthermore, some (perhaps many) of these
structural elements do not yet exist at the time a decision is to be made, so to a large extent,
we must view the population as conceptual. Therefore, we depend on a subset of observations
from the population to help make decisions about the population.
Definition
A sample is a subset of observations selected from a population.
For statistical methods to be valid, the sample must be representative of the population. It
is often tempting to select the observations that are most convenient as the sample or to exer-
cise judgment in sample selection. These procedures can frequently introduce bias into the
sample, and as a result the parameter of interest will be consistently underestimated (or over-
estimated) by such a sample. Furthermore, the behavior of a judgment sample cannot be statis-
tically described. To avoid these difficulties, it is desirable to select a random sample as the
result of some chance mechanism. Consequently, the selection of a sample is a random exper-
iment and each observation in the sample is the observed value of a random variable. The
observations in the population determine the probability distribution of the random variable.
To define a random sample, let X be a random variable that represents the result of one se-
lection of an observation from the population. Let f(x) denote the probability density function
of X. Suppose that each observation in the sample is obtained independently, under unchanging
conditions. That is, the observations for the sample are obtained by observing X independently
under unchanging conditions, say, n times. Let X i denote the random variable that represents
the ith replicate. Then, X , X , p , X n is a random sample and the numerical values obtained
2
1
are denoted as x , x , p , x . The random variables in a random sample are independent with
2
n
1
the same probability distribution f(x) because of the identical conditions under which each
observation is obtained. That is, the marginal probability density function of X , X , p , X n is
2
1