
Page 240 - Applied Statistics And Probability For Engineers
P. 240
c06.qxd 5/14/02 9:54 M Page 201 RK UL 6 RK UL 6:Desktop Folder:TEMP WORK:MONTGOMERY:REVISES UPLO D CH114 FIN L:Quark Files:
6-3 STEM-AND-LEAF DIAGRAMS 201
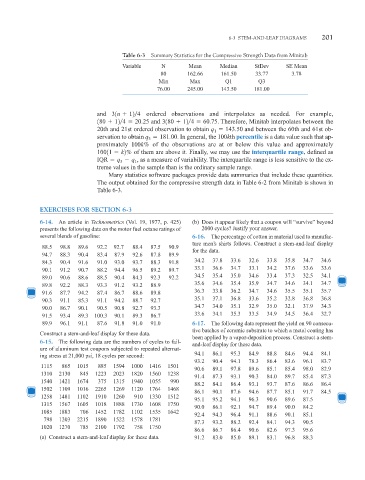
Table 6-3 Summary Statistics for the Compressive Strength Data from Minitab
Variable N Mean Median StDev SE Mean
80 162.66 161.50 33.77 3.78
Min Max Q1 Q3
76.00 245.00 143.50 181.00
and 31n 12 4 ordered observations and interpolates as needed. For example,
180 12 4 20.25 and 3180 12 4 60.75. Therefore, Minitab interpolates between the
20th and 21st ordered observation to obtain q 143.50 and between the 60th and 61st ob-
1
servation to obtain q 181.00. In general, the 100kth percentile is a data value such that ap-
3
proximately 100k% of the observations are at or below this value and approximately
10011 k2% of them are above it. Finally, we may use the interquartile range, defined as
IQR q q , as a measure of variability. The interquartile range is less sensitive to the ex-
1
3
treme values in the sample than is the ordinary sample range.
Many statistics software packages provide data summaries that include these quantities.
The output obtained for the compressive strength data in Table 6-2 from Minitab is shown in
Table 6-3.
EXERCISES FOR SECTION 6-3
6-14. An article in Technometrics (Vol. 19, 1977, p. 425) (b) Does it appear likely that a coupon will “survive” beyond
presents the following data on the motor fuel octane ratings of 2000 cycles? Justify your answer.
several blends of gasoline: 6-16. The percentage of cotton in material used to manufac-
ture men’s shirts follows. Construct a stem-and-leaf display
88.5 98.8 89.6 92.2 92.7 88.4 87.5 90.9
for the data.
94.7 88.3 90.4 83.4 87.9 92.6 87.8 89.9
84.3 90.4 91.6 91.0 93.0 93.7 88.3 91.8 34.2 37.8 33.6 32.6 33.8 35.8 34.7 34.6
90.1 91.2 90.7 88.2 94.4 96.5 89.2 89.7 33.1 36.6 34.7 33.1 34.2 37.6 33.6 33.6
89.0 90.6 88.6 88.5 90.4 84.3 92.3 92.2 34.5 35.4 35.0 34.6 33.4 37.3 32.5 34.1
89.8 92.2 88.3 93.3 91.2 93.2 88.9 35.6 34.6 35.4 35.9 34.7 34.6 34.1 34.7
91.6 87.7 94.2 87.4 86.7 88.6 89.8 36.3 33.8 36.2 34.7 34.6 35.5 35.1 35.7
90.3 91.1 85.3 91.1 94.2 88.7 92.7 35.1 37.1 36.8 33.6 35.2 32.8 36.8 36.8
90.0 86.7 90.1 90.5 90.8 92.7 93.3 34.7 34.0 35.1 32.9 35.0 32.1 37.9 34.3
91.5 93.4 89.3 100.3 90.1 89.3 86.7 33.6 34.1 35.3 33.5 34.9 34.5 36.4 32.7
89.9 96.1 91.1 87.6 91.8 91.0 91.0 6-17. The following data represent the yield on 90 consecu-
tive batches of ceramic substrate to which a metal coating has
Construct a stem-and-leaf display for these data.
been applied by a vapor-deposition process. Construct a stem-
6-15. The following data are the numbers of cycles to fail-
and-leaf display for these data.
ure of aluminum test coupons subjected to repeated alternat-
ing stress at 21,000 psi, 18 cycles per second: 94.1 86.1 95.3 84.9 88.8 84.6 94.4 84.1
93.2 90.4 94.1 78.3 86.4 83.6 96.1 83.7
1115 865 1015 885 1594 1000 1416 1501
90.6 89.1 97.8 89.6 85.1 85.4 98.0 82.9
1310 2130 845 1223 2023 1820 1560 1238
91.4 87.3 93.1 90.3 84.0 89.7 85.4 87.3
1540 1421 1674 375 1315 1940 1055 990
88.2 84.1 86.4 93.1 93.7 87.6 86.6 86.4
1502 1109 1016 2265 1269 1120 1764 1468
86.1 90.1 87.6 94.6 87.7 85.1 91.7 84.5
1258 1481 1102 1910 1260 910 1330 1512
95.1 95.2 94.1 96.3 90.6 89.6 87.5
1315 1567 1605 1018 1888 1730 1608 1750
90.0 86.1 92.1 94.7 89.4 90.0 84.2
1085 1883 706 1452 1782 1102 1535 1642
92.4 94.3 96.4 91.1 88.6 90.1 85.1
798 1203 2215 1890 1522 1578 1781
87.3 93.2 88.2 92.4 84.1 94.3 90.5
1020 1270 785 2100 1792 758 1750
86.6 86.7 86.4 90.6 82.6 97.3 95.6
(a) Construct a stem-and-leaf display for these data. 91.2 83.0 85.0 89.1 83.1 96.8 88.3