
Page 245 - Applied Statistics And Probability For Engineers
P. 245
c06.qxd 5/14/02 9:55 M Page 206 RK UL 6 RK UL 6:Desktop Folder:TEMP WORK:MONTGOMERY:REVISES UPLO D CH114 FIN L:Quark Files:
206 CHAPTER 6 RANDOM SAMPLING AND DATA DESCRIPTION
Figure 6-11
x x x x x
Histograms for sym-
x
metric and skewed dis- Negative or left skew Symmetric Positive or right skew
tributions. (a) (b) (c)
distribution is skewed to the right, whereas mode
median
mean if the distribution is
skewed to the left.
Frequency distributions and histograms can also be used with qualitative or categorical
data. In some applications there will be a natural ordering of the categories (such as freshman,
sophomore, junior, and senior), whereas in others the order of the categories will be arbitrary
(such as male and female). When using categorical data, the bins should have equal width.
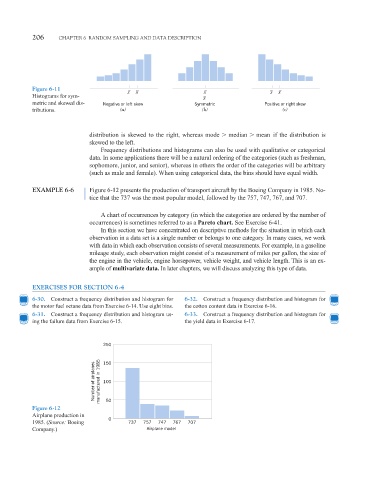
EXAMPLE 6-6 Figure 6-12 presents the production of transport aircraft by the Boeing Company in 1985. No-
tice that the 737 was the most popular model, followed by the 757, 747, 767, and 707.
A chart of occurrences by category (in which the categories are ordered by the number of
occurrences) is sometimes referred to as a Pareto chart. See Exercise 6-41.
In this section we have concentrated on descriptive methods for the situation in which each
observation in a data set is a single number or belongs to one category. In many cases, we work
with data in which each observation consists of several measurements. For example, in a gasoline
mileage study, each observation might consist of a measurement of miles per gallon, the size of
the engine in the vehicle, engine horsepower, vehicle weight, and vehicle length. This is an ex-
ample of multivariate data. In later chapters, we will discuss analyzing this type of data.
EXERCISES FOR SECTION 6-4
6-30. Construct a frequency distribution and histogram for 6-32. Construct a frequency distribution and histogram for
the motor fuel octane data from Exercise 6-14. Use eight bins. the cotton content data in Exercise 6-16.
6-31. Construct a frequency distribution and histogram us- 6-33. Construct a frequency distribution and histogram for
ing the failure data from Exercise 6-15. the yield data in Exercise 6-17.
250
150
Number of airplanes manufactured in 1985 100
Figure 6-12 50
Airplane production in
0
1985. (Source: Boeing 737 757 747 767 707
Company.) Airplane model