
Page 247 - Applied Statistics And Probability For Engineers
P. 247
c06.qxd 5/14/02 9:55 M Page 208 RK UL 6 RK UL 6:Desktop Folder:TEMP WORK:MONTGOMERY:REVISES UPLO D CH114 FIN L:Quark Files:
208 CHAPTER 6 RANDOM SAMPLING AND DATA DESCRIPTION
120
110
Quality index 100
90
80
70
100 150 200 250 1 2 3
Strength Plant
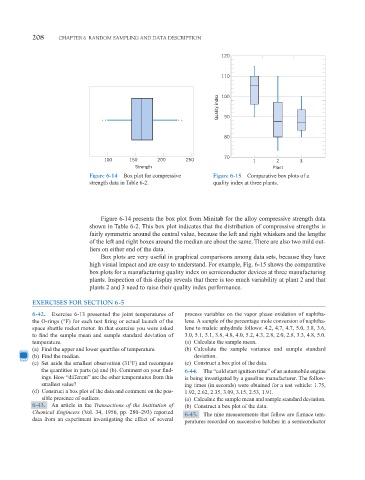
Figure 6-14 Box plot for compressive Figure 6-15 Comparative box plots of a
strength data in Table 6-2. quality index at three plants.
Figure 6-14 presents the box plot from Minitab for the alloy compressive strength data
shown in Table 6-2. This box plot indicates that the distribution of compressive strengths is
fairly symmetric around the central value, because the left and right whiskers and the lengths
of the left and right boxes around the median are about the same. There are also two mild out-
liers on either end of the data.
Box plots are very useful in graphical comparisons among data sets, because they have
high visual impact and are easy to understand. For example, Fig. 6-15 shows the comparative
box plots for a manufacturing quality index on semiconductor devices at three manufacturing
plants. Inspection of this display reveals that there is too much variability at plant 2 and that
plants 2 and 3 need to raise their quality index performance.
EXERCISES FOR SECTION 6-5
6-42. Exercise 6-13 presented the joint temperatures of process variables on the vapor phase oxidation of naphtha-
the O-rings (°F) for each test firing or actual launch of the lene. A sample of the percentage mole conversion of naphtha-
space shuttle rocket motor. In that exercise you were asked lene to maleic anhydride follows: 4.2, 4.7, 4.7, 5.0, 3.8, 3.6,
to find the sample mean and sample standard deviation of 3.0, 5.1, 3.1, 3.8, 4.8, 4.0, 5.2, 4.3, 2.8, 2.0, 2.8, 3.3, 4.8, 5.0.
temperature. (a) Calculate the sample mean.
(a) Find the upper and lower quartiles of temperature. (b) Calculate the sample variance and sample standard
(b) Find the median. deviation.
(c) Set aside the smallest observation (31 F2 and recompute (c) Construct a box plot of the data.
the quantities in parts (a) and (b). Comment on your find- 6-44. The “cold start ignition time” of an automobile engine
ings. How “different” are the other temperatures from this is being investigated by a gasoline manufacturer. The follow-
smallest value? ing times (in seconds) were obtained for a test vehicle: 1.75,
(d) Construct a box plot of the data and comment on the pos- 1.92, 2.62, 2.35, 3.09, 3.15, 2.53, 1.91.
sible presence of outliers. (a) Calculate the sample mean and sample standard deviation.
6-43. An article in the Transactions of the Institution of (b) Construct a box plot of the data.
Chemical Engineers (Vol. 34, 1956, pp. 280–293) reported
6-45. The nine measurements that follow are furnace tem-
data from an experiment investigating the effect of several
peratures recorded on successive batches in a semiconductor