
Page 251 - Applied Statistics And Probability For Engineers
P. 251
c06.qxd 5/14/02 9:55 M Page 212 RK UL 6 RK UL 6:Desktop Folder:TEMP WORK:MONTGOMERY:REVISES UPLO D CH114 FIN L:Quark Files:
212 CHAPTER 6 RANDOM SAMPLING AND DATA DESCRIPTION
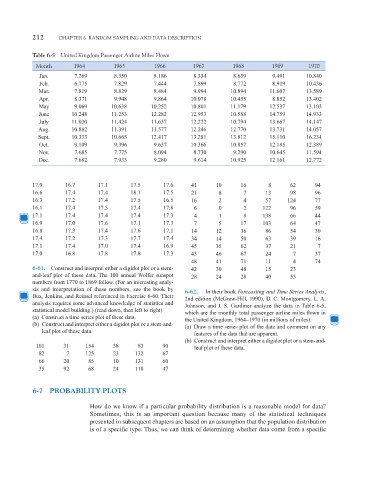
Table 6-5 United Kingdom Passenger Airline Miles Flown
Month 1964 1965 1966 1967 1968 1969 1970
Jan. 7.269 8.350 8.186 8.334 8.639 9.491 10.840
Feb. 6.775 7.829 7.444 7.899 8.772 8.919 10.436
Mar. 7.819 8.829 8.484 9.994 10.894 11.607 13.589
Apr. 8.371 9.948 9.864 10.078 10.455 8.852 13.402
May 9.069 10.638 10.252 10.801 11.179 12.537 13.103
June 10.248 11.253 12.282 12.953 10.588 14.759 14.933
July 11.030 11.424 11.637 12.222 10.794 13.667 14.147
Aug. 10.882 11.391 11.577 12.246 12.770 13.731 14.057
Sept. 10.333 10.665 12.417 13.281 13.812 15.110 16.234
Oct. 9.109 9.396 9.637 10.366 10.857 12.185 12.389
Nov. 7.685 7.775 8.094 8.730 9.290 10.645 11.594
Dec. 7.682 7.933 9.280 9.614 10.925 12.161 12.772
17.0 16.7 17.1 17.5 17.6 41 10 16 8 62 94
16.6 17.4 17.4 18.1 17.5 21 8 7 13 98 96
16.3 17.2 17.4 17.5 16.5 16 2 4 57 124 77
16.1 17.4 17.5 17.4 17.8 6 0 2 122 96 59
17.1 17.4 17.4 17.4 17.3 4 1 8 138 66 44
16.9 17.0 17.6 17.1 17.3 7 5 17 103 64 47
16.8 17.3 17.4 17.6 17.1 14 12 36 86 54 30
17.4 17.2 17.3 17.7 17.4 34 14 50 63 39 16
17.1 17.4 17.0 17.4 16.9 45 35 62 37 21 7
17.0 16.8 17.8 17.8 17.3 43 46 67 24 7 37
48 41 71 11 4 74
6-61. Construct and interpret either a digidot plot or a stem- 42 30 48 15 23
and-leaf plot of these data. The 100 annual Wolfer sunspot 28 24 28 40 55
numbers from 1770 to 1869 follow. (For an interesting analy-
sis and interpretation of these numbers, see the book by 6-62. In their book Forecasting and Time Series Analysis,
Box, Jenkins, and Reinsel referenced in Exercise 6-60. Their 2nd edition (McGraw-Hill, 1990), D. C. Montgomery, L. A.
analysis requires some advanced knowledge of statistics and Johnson, and J. S. Gardiner analyze the data in Table 6-5,
statistical model building.) (read down, then left to right) which are the monthly total passenger airline miles flown in
(a) Construct a time series plot of these data. the United Kingdom, 1964–1970 (in millions of miles).
(b) Construct and interpret either a digidot plot or a stem-and- (a) Draw a time series plot of the data and comment on any
leaf plot of these data.
features of the data that are apparent.
(b) Construct and interpret either a digidot plot or a stem-and-
101 31 154 38 83 90 leaf plot of these data.
82 7 125 23 132 67
66 20 85 10 131 60
35 92 68 24 118 47
6-7 PROBABILITY PLOTS
How do we know if a particular probability distribution is a reasonable model for data?
Sometimes, this is an important question because many of the statistical techniques
presented in subsequent chapters are based on an assumption that the population distribution
is of a specific type. Thus, we can think of determining whether data come from a specific