
Page 238 - Applied Statistics And Probability For Engineers
P. 238
c06.qxd 5/14/02 9:54 M Page 199 RK UL 6 RK UL 6:Desktop Folder:TEMP WORK:MONTGOMERY:REVISES UPLO D CH114 FIN L:Quark Files:
6-3 STEM-AND-LEAF DIAGRAMS 199
Stem Leaf Frequency
7 6 1
8 7 1
9 7 1
10 5 1 2
11 5 8 0 3
12 1 0 3 3
13 4 1 3 5 3 5 6
14 2 9 5 8 3 1 6 9 8
15 4 7 1 3 4 0 8 8 6 8 0 8 12
16 3 0 7 3 0 5 0 8 7 9 10
17 8 5 4 4 1 6 2 1 0 6 10
18 0 3 6 1 4 1 0 7
19 9 6 0 9 3 4 6
20 7 1 0 8 4
21 8 1
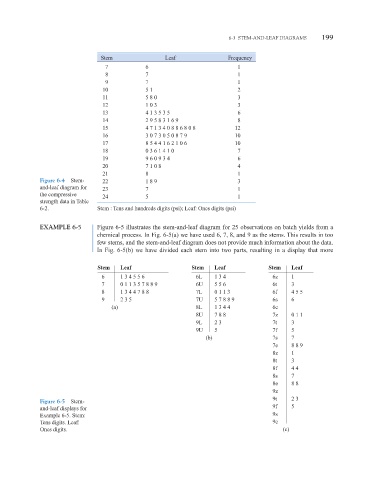
Figure 6-4 Stem- 22 1 8 9 3
and-leaf diagram for 23 7 1
the compressive 24 5 1
strength data in Table
6-2. Stem : Tens and hundreds digits (psi); Leaf: Ones digits (psi)
EXAMPLE 6-5 Figure 6-5 illustrates the stem-and-leaf diagram for 25 observations on batch yields from a
chemical process. In Fig. 6-5(a) we have used 6, 7, 8, and 9 as the stems. This results in too
few stems, and the stem-and-leaf diagram does not provide much information about the data.
In Fig. 6-5(b) we have divided each stem into two parts, resulting in a display that more
Stem Leaf Stem Leaf Stem Leaf
6 1 3 4 5 5 6 6L 1 3 4 6z 1
7 0 1 1 3 5 7 8 8 9 6U 5 5 6 6t 3
8 1 3 4 4 7 8 8 7L 0 1 1 3 6f 4 5 5
9 2 3 5 7U 5 7 8 8 9 6s 6
(a) 8L 1 3 4 4 6e
8U 7 8 8 7z 0 1 1
9L 2 3 7t 3
9U 5 7f 5
(b) 7s 7
7e 8 8 9
8z 1
8t 3
8f 4 4
8s 7
8e 8 8
9z
Figure 6-5 Stem- 9t 2 3
and-leaf displays for 9f 5
Example 6-5. Stem: 9s
Tens digits. Leaf: 9e
Ones digits. (c)