Page 303 - Applied Statistics And Probability For Engineers
P. 303

c08.qxd  5/15/02  6:13 PM  Page 255 RK UL 6 RK UL 6:Desktop Folder:TEMP WORK:MONTGOMERY:REVISES UPLO D CH114 FIN L:Quark Files:


                             8-2 CONFIDENCE INTERVAL ON THE MEAN OF A NORMAL DISTRIBUTION, VARIANCE KNOWN  255


                                   The summary statistics from Minitab are displayed below:


                                       Descriptive Statistics: Concentration
                                       Variable            N      Mean   Median   TrMean   StDev  SE Mean
                                       Concentration      53     0.5250   0.4900   0.5094  0.3486   0.0479
                                       Variable     Minimum    Maximum       Q1       Q3
                                       Concentration   0.0400    1.3300   0.2300   0.7900


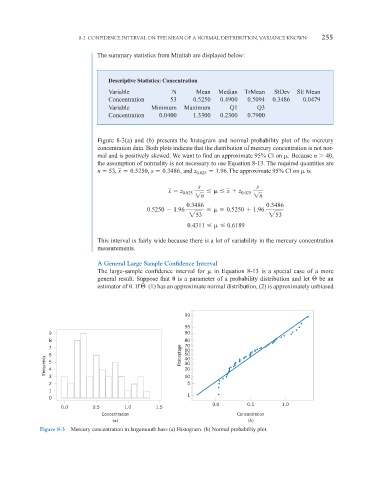
                                   Figure 8-3(a) and (b) presents the histogram and normal probability plot of the mercury
                                   concentration data. Both plots indicate that the distribution of mercury concentration is not nor-
                                   mal and is positively skewed. We want to find an approximate 95% CI on  . Because n 
 40,
                                   the assumption of normality is not necessary to use Equation 8-13. The required quantities are
                                   n   53, x   0.5250, s   0.3486 , and z 0.025   1.96. The approximate 95% CI on   is

                                                                   s                 s
                                                          x   z 0.025        x   z 0.025
                                                                  1n                 1n
                                                               0.3486                    0.3486
                                                   0.5250   1.96          0.5250   1.96
                                                                253                      253
                                                                0.4311     0.6189

                                   This interval is fairly wide because there is a lot of variability in the mercury concentration
                                   measurements.

                                   A General Large Sample Confidence Interval
                                   The large-sample confidence interval for   in Equation 8-13 is a special case of a more
                                                                                                       ˆ
                                   general result. Suppose that   is a parameter of a probability distribution and let    be an
                                                 ˆ
                                   estimator of  . If    (1) has an approximate normal distribution, (2) is approximately unbiased


                                                               99
                                                               95
                    9                                          90
                    8                                          80
                    7                                          70
                                                               60
                    6                                         Percentage  50
                   Frequency  5                                30
                                                               40
                                                               20
                    4
                    3                                          10
                    2                                           5
                    1
                                                                1
                    0
                                                                        0.0        0.5       1.0
                        0.0       0.5       1.0       1.5
                                     Concentration                             Concentration
                                        (a)                                        (b)
                 Figure 8-3  Mercury concentration in largemouth bass (a) Histogram. (b) Normal probability plot.
   298   299   300   301   302   303   304   305   306   307   308