
Page 320 - Applied Statistics And Probability For Engineers
P. 320
c08.qxd 5/15/02 6:13 PM Page 272 RK UL 6 RK UL 6:Desktop Folder:TEMP WORK:MONTGOMERY:REVISES UPLO D CH114 FIN L:Quark Files:
272 CHAPTER 8 STATISTICAL INTERVALS FOR A SINGLE SAMPLE
Supplemental Exercises 99
8-70. Consider the confidence interval for with known 95
90
standard deviation :
80
70
1n
x z 1 1n x z 2 60
Percentage 50
where 1 2 . Let 0.05 and find the interval for 40
1 2 2 0.025. Now find the interval for the case
30
1 0.01 and 2 0.04. Which interval is shorter? Is there
20
any advantage to a “symmetric” confidence interval?
10
8-71. A normal population has a known mean 50 and
5
unknown variance.
(a) A random sample of n 16 is selected from this popula-
1
tion, and the sample results are 52 and s 8. How
x
unusual are these results? That is, what is the probability 13.5 14.0 14.5 15.0 15.5 16.0 16.5 17.0
of observing a sample average as large as 52 (or larger) if Hemoglobin Level
the known, underlying mean is actually 50?
(b) A random sample of n 30 is selected from this popula-
x
tion, and the sample results are 52 and s 8. How
unusual are these results? (b) Explain why this check of the distribution underlying the
(c) A random sample of n 100 is selected from this popula- sample data is important if we want to construct a confi-
x
tion, and the sample results are 52 and s 8. How dence interval on the mean.
unusual are these results? (c) Based on this sample data, a 95% confidence interval for
(d) Compare your answers to parts (a)–(c) and explain why the mean is (15.04, 15.62). Is it reasonable to infer that the
they are the same or differ. true mean could be 14.5? Explain your answer.
8-72. A normal population has known mean 50 and (d) Explain why this check of the distribution underlying the
2
variance 5. What is the approximate probability that the sample data is important if we want to construct a confi-
sample variance is greater than or equal to 7.44? less than or dence interval on the variance.
equal to 2.56? (e) Based on this sample data, a 95% confidence interval
(a) For a random sample of n 16. for the variance is (0.22, 0.82). Is it reasonable to infer
(b) For a random sample of n 30. that the true variance could be 0.35? Explain your
(c) For a random sample of n 71. answer.
(d) Compare your answers to parts (a)–(c) for the approxi- (f) Is it reasonable to use these confidence intervals to draw
mate probability that the sample variance is greater than an inference about the mean and variance of hemoglobin
or equal to 7.44. Explain why this tail probability is levels
increasing or decreasing with increased sample size. (i) of Canadian doctors? Explain your answer.
(e) Compare your answers to parts (a)–(c) for the approxi- (ii) of Canadian children ages 6–12? Explain your answer.
mate probability that the sample variance is less than or 8-74. The article “Mix Design for Optimal Strength
equal to 2.56. Explain why this tail probability is increas- Development of Fly Ash Concrete” (Cement and Concrete
ing or decreasing with increased sample size.
Research, 1989, Vol. 19, No. 4, pp. 634–640) investigates
8-73. An article in the Journal of Sports Science (1987, Vol. the compressive strength of concrete when mixed with fly
5, pp. 261–271) presents the results of an investigation of the ash (a mixture of silica, alumina, iron, magnesium oxide,
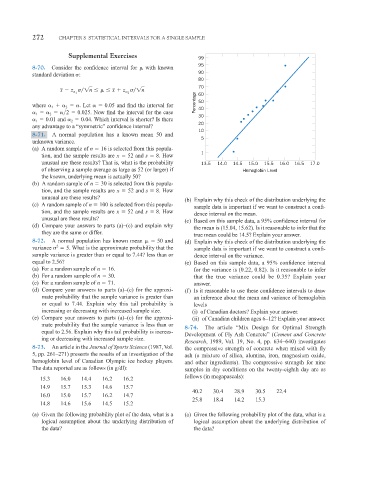
hemoglobin level of Canadian Olympic ice hockey players. and other ingredients). The compressive strength for nine
The data reported are as follows (in g/dl): samples in dry conditions on the twenty-eighth day are as
15.3 16.0 14.4 16.2 16.2 follows (in megapascals):
14.9 15.7 15.3 14.6 15.7
40.2 30.4 28.9 30.5 22.4
16.0 15.0 15.7 16.2 14.7
25.8 18.4 14.2 15.3
14.8 14.6 15.6 14.5 15.2
(a) Given the following probability plot of the data, what is a (a) Given the following probability plot of the data, what is a
logical assumption about the underlying distribution of logical assumption about the underlying distribution of
the data? the data?