
Page 321 - Applied Statistics And Probability For Engineers
P. 321
c08.qxd 5/15/02 6:13 PM Page 273 RK UL 6 RK UL 6:Desktop Folder:TEMP WORK:MONTGOMERY:REVISES UPLO D CH114 FIN L:Quark Files:
8-7 TOLERABLE INTERVALS FOR A NORMAL DISTRIBUTION 273
99 8-75. An operating system for a personal computer has been
studied extensively, and it is known that the standard deviation
95 of the response time following a particular command is 8
90 milliseconds. A new version of the operating system is
80
installed, and we wish to estimate the mean response time for
70 the new system to ensure that a 95% confidence interval for
Percentage 60 has length at most 5 milliseconds.
50
(a) If we can assume that response time is normally distributed
40
30 and that 8 for the new system, what sample size would
you recommend?
20
(b) Suppose that we are told by the vendor that the standard
10
deviation of the response time of the new system is
5
smaller, say 6; give the sample size that you recom-
mend and comment on the effect the smaller standard
1
deviation has on this calculation.
0 10 20 30 40 50 8-76. Consider the hemoglobin data in Exercise 8-73. Find
Strength
the following:
(a) An interval that contains 95% of the hemoglobin values
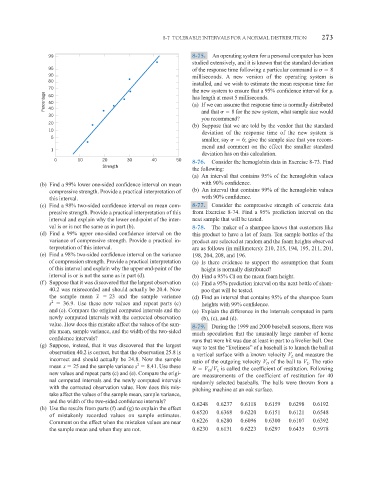
(b) Find a 99% lower one-sided confidence interval on mean with 90% confidence.
compressive strength. Provide a practical interpretation of (b) An interval that contains 99% of the hemoglobin values
this interval. with 90% confidence.
(c) Find a 98% two-sided confidence interval on mean com- 8-77. Consider the compressive strength of concrete data
pressive strength. Provide a practical interpretation of this from Exercise 8-74. Find a 95% prediction interval on the
interval and explain why the lower end-point of the inter- next sample that will be tested.
val is or is not the same as in part (b). 8-78. The maker of a shampoo knows that customers like
(d) Find a 99% upper one-sided confidence interval on the this product to have a lot of foam. Ten sample bottles of the
variance of compressive strength. Provide a practical in- product are selected at random and the foam heights observed
terpretation of this interval. are as follows (in millimeters): 210, 215, 194, 195, 211, 201,
(e) Find a 98% two-sided confidence interval on the variance 198, 204, 208, and 196.
of compression strength. Provide a practical interpretation (a) Is there evidence to support the assumption that foam
of this interval and explain why the upper end-point of the height is normally distributed?
interval is or is not the same as in part (d). (b) Find a 95% CI on the mean foam height.
(f) Suppose that it was discovered that the largest observation (c) Find a 95% prediction interval on the next bottle of sham-
40.2 was misrecorded and should actually be 20.4. Now poo that will be tested.
the sample mean x 23 and the sample variance (d) Find an interval that contains 95% of the shampoo foam
2
s 36.9. Use these new values and repeat parts (c) heights with 99% confidence.
and (e). Compare the original computed intervals and the (e) Explain the difference in the intervals computed in parts
newly computed intervals with the corrected observation (b), (c), and (d).
value. How does this mistake affect the values of the sam- 8-79. During the 1999 and 2000 baseball seasons, there was
ple mean, sample variance, and the width of the two-sided much speculation that the unusually large number of home
confidence intervals? runs that were hit was due at least in part to a livelier ball. One
(g) Suppose, instead, that it was discovered that the largest way to test the “liveliness” of a baseball is to launch the ball at
observation 40.2 is correct, but that the observation 25.8 is a vertical surface with a known velocity V L and measure the
incorrect and should actually be 24.8. Now the sample ratio of the outgoing velocity V O of the ball to V L . The ratio
2
mean 25 and the sample variance s 8.41. Use these R V O V L is called the coefficient of restitution. Following
x
new values and repeat parts (c) and (e). Compare the origi- are measurements of the coefficient of restitution for 40
nal computed intervals and the newly computed intervals randomly selected baseballs. The balls were thrown from a
with the corrected observation value. How does this mis- pitching machine at an oak surface.
take affect the values of the sample mean, sample variance,
and the width of the two-sided confidence intervals?
0.6248 0.6237 0.6118 0.6159 0.6298 0.6192
(h) Use the results from parts (f) and (g) to explain the effect
0.6520 0.6368 0.6220 0.6151 0.6121 0.6548
of mistakenly recorded values on sample estimates.
Comment on the effect when the mistaken values are near 0.6226 0.6280 0.6096 0.6300 0.6107 0.6392
the sample mean and when they are not. 0.6230 0.6131 0.6223 0.6297 0.6435 0.5978