Page 326 - Applied Statistics And Probability For Engineers
P. 326

PQ220 6234F.CD(08)  5/15/02  6:38 PM  Page 2 RK UL 6 RK UL 6:Desktop Folder:TEMP WORK:MONTGOMERY:REVISES UPLO D CH114 FIN L:Quark F


               8-2


                            80                                      100

                                                                     80
                            60
                           Frequency  40                           Frequency  60

                                                                     40
                            20
                                                                     20

                             0                                        0
                              0   0.03  0.06  0.09  0.12  0.15  0.18  _ 0.04    0      0.04     0.08    0.12
                                                                                       ^ * _
                                              λ i                                      λ i  λ *
                                                                                                 ^
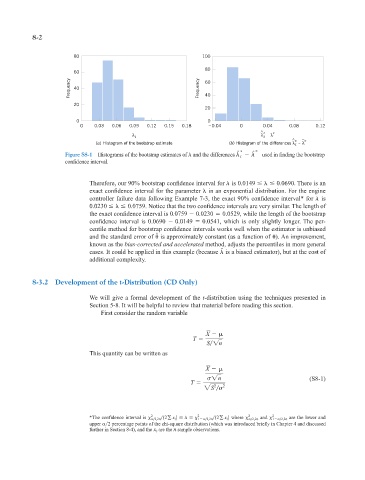
                                   (a) Histogram of the bootstrap estimate   (b) Histogram of the differences λ i * _  λ *
                         Figure S8-1 Histograms of the bootstrap estimates of  and the differences         ˆ * i  ˆ  *  used in finding the bootstrap
                         confidence interval.


                                 Therefore, our 90% bootstrap confidence interval for   is 0.0149 
 
 0.0690. There is an
                                 exact confidence interval for the parameter   in an exponential distribution. For the engine
                                 controller failure data following Example 7-3, the exact 90% confidence interval* for   is
                                 0.0230 
  
 0.0759. Notice that the two confidence intervals are very similar. The length of
                                 the exact confidence interval is 0.0759   0.0230   0.0529, while the length of the bootstrap
                                 confidence interval is 0.0690   0.0149   0.0541, which is only slightly longer. The per-
                                 centile method for bootstrap confidence intervals works well when the estimator is unbiased
                                                      ˆ
                                 and the standard error of  is approximately constant (as a function of  ). An improvement,

                                 known as the bias-corrected and accelerated method, adjusts the percentiles in more general
                                                                          ˆ
                                 cases. It could be applied in this example (because  is a biased estimator), but at the cost of

                                 additional complexity.
               8-3.2  Development of the t-Distribution (CD Only)

                                 We will give a formal development of the t-distribution using the techniques presented in
                                 Section 5-8. It will be helpful to review that material before reading this section.
                                    First consider the random variable


                                                                     X
                                                                 T
                                                                      S  1n
                                 This quantity can be written as

                                                                     X
                                                                       1 n                            (S8-1)
                                                                 T
                                                                        2
                                                                     2S    2


                                                                                   2
                                                    2
                                                                   2
                                                                                          2
                                 *The confidence interval is      2,2n 12g x i 2 
   
  1    2,2n 12g x i 2  where      2,2n  and   1    2,2n  are the lower and
                                 upper   2 percentage points of the chi-square distribution (which was introduced briefly in Chapter 4 and discussed
                                                           n
                                 further in Section 8-4), and the x i  are the  sample observations.
   321   322   323   324   325   326   327   328   329   330   331