Page 335 - Applied Statistics And Probability For Engineers
P. 335

c09.qxd  5/15/02  8:02 PM  Page 283 RK UL 9 RK UL 9:Desktop Folder:


                                                                                 9-1 HYPOTHESIS TESTING   283


                                         0.6                                0.6
                                                                                      µ
                                                                µ
                                                   µ
                                             Under H 0 :    = 50  Under H 1 :    = 52  Under H 0 :    = 50
                                                                                                  µ
                                         0.5                                0.5            Under H 1 :    = 50.5
                                        Probability density  0.3           Probability density  0.3
                                                                            0.4
                                         0.4
                                                                            0.2
                                         0.2
                                         0.1                                0.1
                                          0                                  0
                                           46   48   50    52   54   56       46   48   50   52    54   56
                                                         –                                 –
                                                         x                                 x
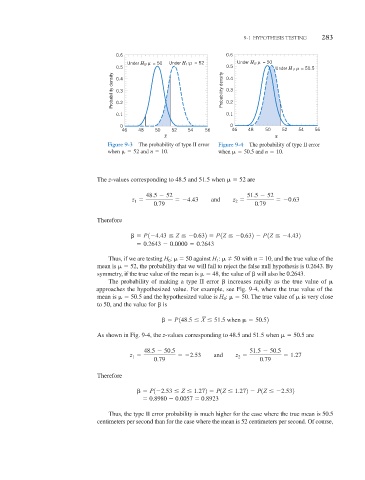
                                       Figure 9-3  The probability of type II error  Figure 9-4 The probability of type II error
                                       when    52 and n   10.            when    50.5 and n   10.


                                   The z-values corresponding to 48.5 and 51.5 when     52 are

                                                   48.5 
 52                      51.5 
 52
                                              z              
4.43   and   z                 
0.63
                                                                               2
                                               1
                                                     0.79                            0.79
                                   Therefore

                                                   P1
4.43   Z  
0.632   P1Z  
0.632 
 P1Z  
4.432
                                                  0.2643 
 0.0000   0.2643

                                       Thus, if we are testing H :     50 against H :     50 with n   10, and the true value of the
                                                                         1
                                                          0
                                   mean is     52, the probability that we will fail to reject the false null hypothesis is 0.2643. By
                                   symmetry, if the true value of the mean is     48, the value of   will also be 0.2643.
                                       The probability of making a type II error   increases rapidly as the true value of
                                   approaches the hypothesized value. For example, see Fig. 9-4, where the true value of the
                                   mean is     50.5 and the hypothesized value is H :     50. The true value of   is very close
                                                                           0
                                   to 50, and the value for   is

                                                          P148.5   X   51.5 when    50.52

                                   As shown in Fig. 9-4, the z-values corresponding to 48.5 and 51.5 when    50.5 are

                                                  48.5 
 50.5                      51.5 
 50.5
                                              z               
2.53   and   z                   1.27
                                              1
                                                                                2
                                                     0.79                             0.79
                                   Therefore

                                                   P1
2.53   Z   1.272   P1Z   1.272 
 P1Z  
2.532
                                                    0.8980 
 0.0057   0.8923

                                       Thus, the type II error probability is much higher for the case where the true mean is 50.5
                                   centimeters per second than for the case where the mean is 52 centimeters per second. Of course,
   330   331   332   333   334   335   336   337   338   339   340