
Page 336 - Applied Statistics And Probability For Engineers
P. 336
c09.qxd 5/15/02 8:02 PM Page 284 RK UL 9 RK UL 9:Desktop Folder:
284 CHAPTER 9 TESTS OF HYPOTHESES FOR A SINGLE SAMPLE
0.8
µ
µ
Under H 0 : = 50 Under H 1 : = 52
0.6
Probability density 0.4
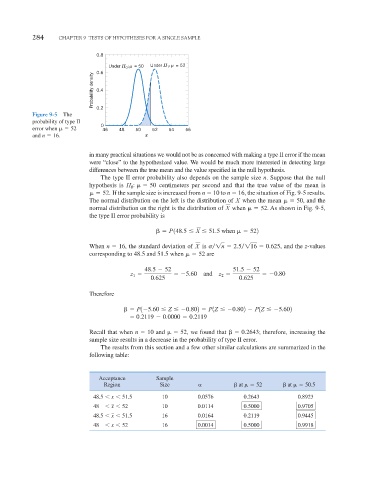
Figure 9-5 The 0.2
probability of type II
0
error when 52 46 48 50 52 54 56
and n 16. – x
in many practical situations we would not be as concerned with making a type II error if the mean
were “close” to the hypothesized value. We would be much more interested in detecting large
differences between the true mean and the value specified in the null hypothesis.
The type II error probability also depends on the sample size n. Suppose that the null
hypothesis is H : 50 centimeters per second and that the true value of the mean is
0
52. If the sample size is increased from n 10 to n 16, the situation of Fig. 9-5 results.
The normal distribution on the left is the distribution of X when the mean 50 , and the
normal distribution on the right is the distribution of X when 52 . As shown in Fig. 9-5,
the type II error probability is
P 148.5 X 51.5 when 522
When n 16 , the standard deviation of X is
1n 2.5
116 0.625 , and the z-values
corresponding to 48.5 and 51.5 when 52 are
48.5
52 51.5
52
z
5.60 and z
0.80
2
1
0.625 0.625
Therefore
P1
5.60 Z
0.802 P1Z
0.802
P1Z
5.602
0.2119
0.0000 0.2119
Recall that when n 10 and 52 , we found that 0.2643 ; therefore, increasing the
sample size results in a decrease in the probability of type II error.
The results from this section and a few other similar calculations are summarized in the
following table:
Acceptance Sample
Region Size at 52 at 50.5
48.5 x 51.5 10 0.0576 0.2643 0.8923
48 x 52 10 0.0114 0.5000 0.9705
48.5 x 51.5 16 0.0164 0.2119 0.9445
48 x 52 16 0.0014 0.5000 0.9918