Page 360 - Applied Statistics And Probability For Engineers
P. 360

c09.qxd  5/16/02  4:15 PM  Page 308 RK UL 6 RK UL 6:Desktop Folder:TEMP WORK:MONTGOMERY:REVISES UPLO D CH114 FIN L:Quark Files:


               308     CHAPTER 9 TESTS OF HYPOTHESES FOR A SINGLE SAMPLE


               f (x)                           f (x)                           f (x)
                               2 n – 1                         2 n – 1                         2 n – 1
                  α /2                                                             α
                                        α /2                            α
                 0    2     α        2    x      0                    α   x      0    2     α             x
                                                                     2
                                       α
                     1 –  /2, n – 1  /2, n – 1                      , n – 1          1 –  , n – 1
                              (a)                            (b)                             (c)
                                                        2
                                                                                          2
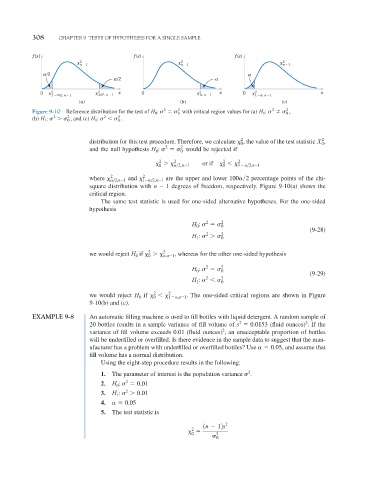
               Figure 9-10  Reference distribution for the test of H 0 : 	  	 0 2  with critical region values for (a) H 1 : 	  	 0 2  ,
                     2    2          2    2
               (b) H 1 : 	  	 0  , and (c) H 1 : 	  	 0  .
                                                                                2                         2
                                 distribution for this test procedure. Therefore, we calculate   0 , the value of the test statistic X 0 ,
                                                         2   2
                                                      0
                                 and the null hypothesis H : 	  	 0  would be rejected if
                                                       2   2               2    2
                                                            
 2, n 1    or if    0    1  
 2,n 1
                                                       0
                                       2          2
                                 where    
 2,n 1  and   1  
 2,n 1  are the upper and lower 100  2 percentage points of the chi-
                                 square distribution with n   1 degrees of freedom, respectively. Figure 9-10(a) shows the
                                 critical region.
                                    The same test statistic is used for one-sided alternative hypotheses. For the one-sided
                                 hypothesis

                                                                      2   2
                                                                 H : 	  	 0
                                                                   0
                                                                                                      (9-28)
                                                                      2   2
                                                                   1
                                                                 H : 	  	 0
                                                   2
                                                        2
                                 we would reject H 0 if   0     ,n 1 ,  whereas for the other one-sided hypothesis
                                                                      2
                                                                 H : 	  	 2 0
                                                                   0
                                                                                                      (9-29)
                                                                      2   2
                                                                   1
                                                                 H : 	  	 0
                                                          2
                                                     2
                                                  if   0    1  ,n 1 .  The one-sided critical regions are shown in Figure
                                 we would reject  H 0
                                 9-10(b) and (c).
               EXAMPLE 9-8       An automatic filling machine is used to fill bottles with liquid detergent. A random sample of
                                                                                2
                                                                                                     2
                                 20 bottles results in a sample variance of fill volume of s   0.0153 (fluid ounces) . If the
                                                                           2
                                 variance of fill volume exceeds 0.01 (fluid ounces) , an unacceptable proportion of bottles
                                 will be underfilled or overfilled. Is there evidence in the sample data to suggest that the man-
                                 ufacturer has a problem with underfilled or overfilled bottles? Use    0.05, and assume that
                                 fill volume has a normal distribution.
                                    Using the eight-step procedure results in the following:
                                                                                   2
                                    1.  The parameter of interest is the population variance 	 .
                                            2
                                    2.  H : 	   0.01
                                         0
                                            2
                                    3.  H : 	   0.01
                                         1
                                    4.     0.05
                                    5.  The test statistic is
                                                                     1n   12s 2
                                                                 2

                                                                 0       2
                                                                        	 0
   355   356   357   358   359   360   361   362   363   364   365