
Page 364 - Applied Statistics And Probability For Engineers
P. 364
c09.qxd 5/16/02 4:15 PM Page 312 RK UL 6 RK UL 6:Desktop Folder:TEMP WORK:MONTGOMERY:REVISES UPLO D CH114 FIN L:Quark Files:
312 CHAPTER 9 TESTS OF HYPOTHESES FOR A SINGLE SAMPLE
Another form of the test statistic Z 0 in Equation 9-32 is occasionally encountered. Note
that if X is the number of observations in a random sample of size n that belongs to a class of
ˆ
interest, then P X
n is the sample proportion that belongs to that class. Now divide both
numerator and denominator of Z in Equation 9-32 by n, giving
0
X
n p 0
Z
0
1p 11 p 2
n
0
0
or
ˆ
P p 0
(9-33)
Z 0
1p 11 p 2
n
0
0
This presents the test statistic in terms of the sample proportion instead of the number of items
X in the sample that belongs to the class of interest.
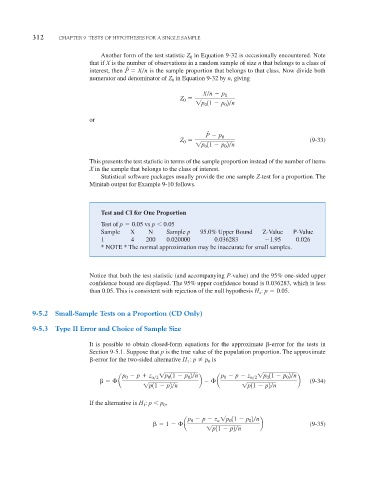
Statistical software packages usually provide the one sample Z-test for a proportion. The
Minitab output for Example 9-10 follows.
Test and CI for One Proportion
Test of p 0.05 vs p 0.05
Sample X N Sample p 95.0% Upper Bound Z-Value P-Value
1 4 200 0.020000 0.036283 1.95 0.026
* NOTE * The normal approximation may be inaccurate for small samples.
Notice that both the test statistic (and accompanying P-value) and the 95% one-sided upper
confidence bound are displayed. The 95% upper confidence bound is 0.036283, which is less
than 0.05. This is consistent with rejection of the null hypothesis H : p 0.05.
o
9-5.2 Small-Sample Tests on a Proportion (CD Only)
9-5.3 Type II Error and Choice of Sample Size
It is possible to obtain closed-form equations for the approximate
-error for the tests in
Section 9-5.1. Suppose that p is the true value of the population proportion. The approximate
-error for the two-sided alternative H 1 : p p 0 is
p p z
2 1p 11 p 2
n p p z
2 1p 11 p 2
n
0
0
0
0
0
0
a b a b (9-34)
1p11 p2
n 1p11 p2
n
: p p ,
If the alternative is H 1 0
p 0 p z 1p 0 11 p 0 2
n
1 a b (9-35)
1p11 p2
n