
Page 366 - Applied Statistics And Probability For Engineers
P. 366
c09.qxd 5/15/02 8:02 PM Page 314 RK UL 9 RK UL 9:Desktop Folder:
314 CHAPTER 9 TESTS OF HYPOTHESES FOR A SINGLE SAMPLE
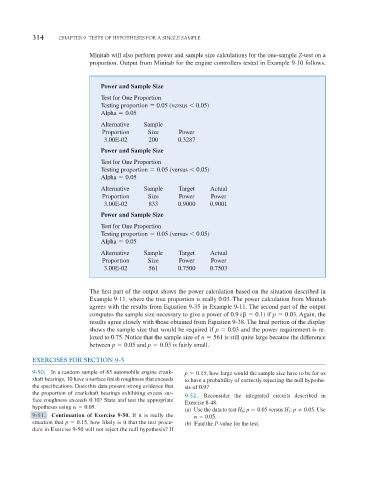
Minitab will also perform power and sample size calculations for the one-sample Z-test on a
proportion. Output from Minitab for the engine controllers tested in Example 9-10 follows.
Power and Sample Size
Test for One Proportion
Testing proportion 0.05 (versus 0.05)
Alpha 0.05
Alternative Sample
Proportion Size Power
3.00E-02 200 0.3287
Power and Sample Size
Test for One Proportion
Testing proportion 0.05 (versus 0.05)
Alpha 0.05
Alternative Sample Target Actual
Proportion Size Power Power
3.00E-02 833 0.9000 0.9001
Power and Sample Size
Test for One Proportion
Testing proportion 0.05 (versus 0.05)
Alpha 0.05
Alternative Sample Target Actual
Proportion Size Power Power
3.00E-02 561 0.7500 0.7503
The first part of the output shows the power calculation based on the situation described in
Example 9-11, where the true proportion is really 0.03. The power calculation from Minitab
agrees with the results from Equation 9-35 in Example 9-11. The second part of the output
computes the sample size necessary to give a power of 0.9 ( 0.1) if p 0.03. Again, the
results agree closely with those obtained from Equation 9-38. The final portion of the display
shows the sample size that would be required if p 0.03 and the power requirement is re-
laxed to 0.75. Notice that the sample size of n 561 is still quite large because the difference
between p 0.05 and p 0.03 is fairly small.
EXERCISES FOR SECTION 9-5
9-50. In a random sample of 85 automobile engine crank- p 0.15, how large would the sample size have to be for us
shaft bearings, 10 have a surface finish roughness that exceeds to have a probability of correctly rejecting the null hypothe-
the specifications. Does this data present strong evidence that sis of 0.9?
the proportion of crankshaft bearings exhibiting excess sur-
9-52. Reconsider the integrated circuits described in
face roughness exceeds 0.10? State and test the appropriate
Exercise 8-48.
hypotheses using 0.05.
(a) Use the data to test H 0 : p 0.05 versus H 1 : p 0.05. Use
9-51. Continuation of Exercise 9-50. If it is really the 0.05.
situation that p 0.15, how likely is it that the test proce- (b) Find the P-value for the test.
dure in Exercise 9-50 will not reject the null hypothesis? If