Page 406 - Applied Statistics And Probability For Engineers
P. 406

c10.qxd  5/16/02  1:31 PM  Page 350 RK UL 6 RK UL 6:Desktop Folder:TEMP WORK:MONTGOMERY:REVISES UPLO D CH114 FIN L:Quark Files:


               350     CHAPTER 10 STATISTICAL INFERENCE FOR TWO SAMPLES

                                              2
                                 and variance    D , so testing hypotheses about the difference between    and    can be
                                                                                                    2
                                                                                             1
                                 accomplished by performing a one-sample t-test on   . Specifically, testing H :
                                                                                                0
                                                                                                        2
                                                                             D
                                                                                                   1
                                   against H :           is equivalent to testing
                                  0
                                                        0
                                           1
                                              1
                                                   2
                                                                 H :       0
                                                                  0
                                                                     D
                                                                   :                                 (10-21)
                                                                 H 1  D    0
                                 The test statistic is given below.
                      The Paired
                           t-Test   Null hypothesis: H 0 :   D    0
                                                       D    0
                                    Test statistic:  T                                            (10-22)
                                                   0
                                                       S D
 1n
                                                Alternative Hypothesis         Rejection Region
                                                    H :       0         t 
 t  
 2, n 1   or  t   t  
 2, n 1
                                                         D
                                                      1
                                                                         0
                                                                                        0
                                                    H :   
   0         t 
 t  , n 1
                                                                         0
                                                         D
                                                      1
                                                    H :       0         t   t   , n 1
                                                      1
                                                         D
                                                                         0
                                 In Equation 10-22, D  is the sample average of the n differences D , D , p , D , and S is the
                                                                                         2
                                                                                                     D
                                                                                      1
                                                                                               n
                                 sample standard deviation of these differences.
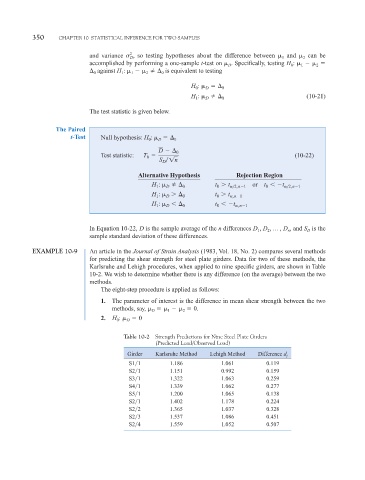
               EXAMPLE 10-9      An article in the Journal of Strain Analysis (1983, Vol. 18, No. 2) compares several methods
                                 for predicting the shear strength for steel plate girders. Data for two of these methods, the
                                 Karlsruhe and Lehigh procedures, when applied to nine specific girders, are shown in Table
                                 10-2. We wish to determine whether there is any difference (on the average) between the two
                                 methods.
                                    The eight-step procedure is applied as follows:
                                    1.  The parameter of interest is the difference in mean shear strength between the two
                                        methods, say,           0.
                                                         1
                                                    D
                                                              2
                                    2.  H :     0
                                         0
                                            D
                                            Table 10-2 Strength Predictions for Nine Steel Plate Girders
                                                      (Predicted Load/Observed Load)
                                             Girder   Karlsruhe Method  Lehigh Method  Difference d j
                                             S1 1         1.186           1.061          0.119
                                             S2 1         1.151           0.992          0.159
                                             S3 1         1.322           1.063          0.259
                                             S4 1         1.339           1.062          0.277
                                             S5 1         1.200           1.065          0.138
                                             S2 1         1.402           1.178          0.224
                                             S2 2         1.365           1.037          0.328
                                             S2 3         1.537           1.086          0.451
                                             S2 4         1.559           1.052          0.507
   401   402   403   404   405   406   407   408   409   410   411