
Page 401 - Applied Statistics And Probability For Engineers
P. 401
c10.qxd 5/16/02 1:31 PM Page 345 RK UL 6 RK UL 6:Desktop Folder:TEMP WORK:MONTGOMERY:REVISES UPLO D CH114 FIN L:Quark Files:
10-3 INFERENCE FOR THE DIFFERENCE IN MEANS OF TWO NORMAL DISTRIBUTIONS, VARIANCES UNKNOWN 345
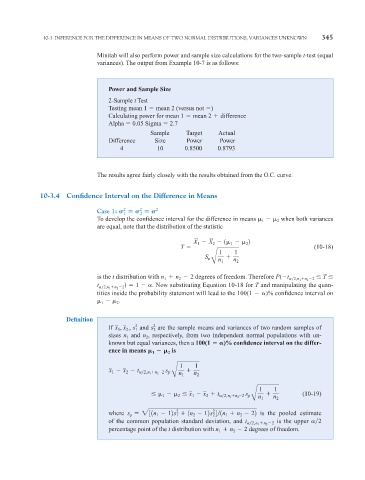
Minitab will also perform power and sample size calculations for the two-sample t-test (equal
variances). The output from Example 10-7 is as follows:
Power and Sample Size
2-Sample t Test
Testing mean 1 mean 2 (versus not )
Calculating power for mean 1 mean 2 difference
Alpha 0.05 Sigma 2.7
Sample Target Actual
Difference Size Power Power
4 10 0.8500 0.8793
The results agree fairly closely with the results obtained from the O.C. curve.
10-3.4 Confidence Interval on the Difference in Means
2
2
Case 1: 2
1
2
To develop the confidence interval for the difference in means when both variances
2
1
are equal, note that the distribution of the statistic
X X 1 2
1
1
2
2
T (10-18)
1 1
S n n
p
B 1 2
is the t distribution with n n 2 degrees of freedom. Therefore P( t 2,n 1 n 2 2 T
2
1
t ) 1 . Now substituting Equation 10-18 for T and manipulating the quan-
2,n 1 n 2 2
tities inside the probability statement will lead to the 100(1 )% confidence interval on
.
2
1
Definition
2
2
If x , x 2 , s and s are the sample means and variances of two random samples of
1
2
1
sizes n and n , respectively, from two independent normal populations with un-
1
2
known but equal variances, then a 100(1 )% confidence interval on the differ-
ence in means is
1
2
1 1
x 1 x 2 t
2, n 1 n 2 2 s p
n
˛
B 1 n 2
1 1
x x t
2, n 1 n 2 2 p (10-19)
˛ s
n
2
1
1
2
B 1 n 2
2
2
where s p 231n 1 12 s 1 1n 2 12 s 2 4
1n 1 n 2 22 is the pooled estimate
is the upper 2
of the common population standard deviation, and t
2, n 1 n 2 2
percentage point of the t distribution with n n 2 degrees of freedom.
2
1