Page 396 - Applied Statistics And Probability For Engineers
P. 396

c10.qxd  5/16/02  1:30 PM  Page 340 RK UL 6 RK UL 6:Desktop Folder:TEMP WORK:MONTGOMERY:REVISES UPLO D CH114 FIN L:Quark Files:


               340     CHAPTER 10 STATISTICAL INFERENCE FOR TWO SAMPLES


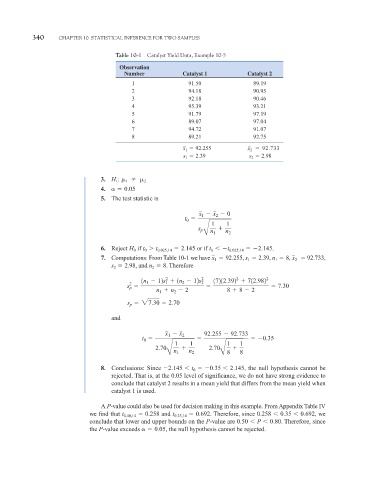
                                         Table 10-1 Catalyst Yield Data, Example 10-5
                                          Observation
                                            Number            Catalyst 1           Catalyst 2
                                              1                 91.50               89.19
                                              2                 94.18               90.95
                                              3                 92.18               90.46
                                              4                 95.39               93.21
                                              5                 91.79               97.19
                                              6                 89.07               97.04
                                              7                 94.72               91.07
                                              8                 89.21               92.75
                                                              x 1    92.255        x 2    92.733
                                                              s 1   2.39           s 2   2.98


                                    3. H :         2
                                         1
                                            1
                                    4.    0.05
                                    5. The test statistic is

                                                                   x   x   0
                                                                    1
                                                                         2
                                                               t
                                                               0
                                                                       1    1
                                                                   s    n     n
                                                                    p
                                                                     B 1     2
                                    6. Reject H if t 
 t 0.025,14    2.145 or if t   t 0.025,14    2.145.
                                               0
                                                  0
                                                                       0
                                    7. Computations: From Table 10-1 we have x 1    92.255, s   2.39, n   8, x 2    92.733,
                                                                                   1
                                                                                           1
                                        s   2.98, and n   8. Therefore
                                                     2
                                        2
                                                         2          2          2         2
                                                 1n   12s 1   1n   12s 2  17212.392   712.982
                                                              2
                                                   1
                                             2
                                             s p                                            7.30
                                                      n 1   n 2   2         8   8   2
                                             s   27.30   2.70
                                              p
                                        and
                                                         x   x 2     92.255   92.733
                                                          1
                                                 t                                    0.35
                                                  0
                                                            1   1           1   1
                                                                      2.70
                                                      2.70˛  n  n
                                                         B 1     2        B8    8
                                    8. Conclusions: Since  2.145   t 0   0.35   2.145, the null hypothesis cannot be
                                        rejected. That is, at the 0.05 level of significance, we do not have strong evidence to
                                        conclude that catalyst 2 results in a mean yield that differs from the mean yield when
                                        catalyst 1 is used.
                                    A P-value could also be used for decision making in this example. From Appendix Table IV
                                 we find that t 0.40,14   0.258 and t 0.25,14   0.692. Therefore, since 0.258   0.35   0.692, we
                                 conclude that lower and upper bounds on the P-value are 0.50   P   0.80. Therefore, since
                                 the P-value exceeds    0.05, the null hypothesis cannot be rejected.
   391   392   393   394   395   396   397   398   399   400   401