Page 395 - Applied Statistics And Probability For Engineers
P. 395

c10.qxd  5/16/02  1:30 PM  Page 339 RK UL 6 RK UL 6:Desktop Folder:TEMP WORK:MONTGOMERY:REVISES UPLO D CH114 FIN L:Quark Files:


                  10-3 INFERENCE FOR THE DIFFERENCE IN MEANS OF TWO NORMAL DISTRIBUTIONS, VARIANCES UNKNOWN  339


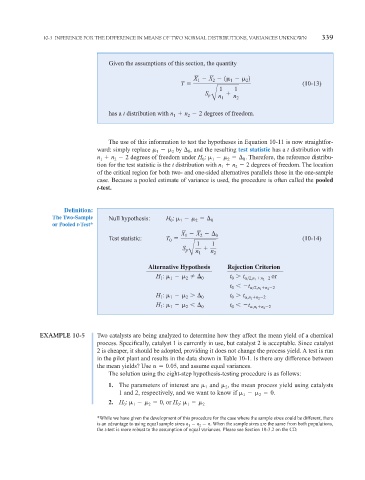
                                       Given the assumptions of this section, the quantity

                                                                  X   X   1     2
                                                                             1
                                                                   1
                                                                        2
                                                                                  2
                                                              T                                     (10-13)
                                                                          1   1
                                                                     S p    n     n
                                                                       B 1     2
                                                               n   2 degrees of freedom.
                                       has a t distribution with n 1  2

                                       The use of this information to test the hypotheses in Equation 10-11 is now straightfor-
                                   ward: simply replace      by   ,  and the resulting test statistic has a t distribution with
                                                                0
                                                      1
                                                           2
                                                                                  . Therefore, the reference distribu-
                                   n   n   2 degrees of freedom under H :          0
                                                                       1
                                                                    0
                                         2
                                    1
                                                                            2
                                   tion for the test statistic is the t distribution with n   n   2 degrees of freedom. The location
                                                                               2
                                                                          1
                                   of the critical region for both two- and one-sided alternatives parallels those in the one-sample
                                   case. Because a pooled estimate of variance is used, the procedure is often called the pooled
                                   t-test.
                         Definition:
                     The Two-Sample    Null hypothesis:  H 0 :   1    2     0
                     or Pooled t-Test*
                                                              X   X      0
                                                                    2
                                                               1
                                       Test statistic:   T                                          (10-14)
                                                          0
                                                                   1   1

                                                              S p
                                                                  n
                                                                B 1    n 2
                                                   Alternative Hypothesis   Rejection Criterion
                                                      H :           0        t 
 t  
 2,n 1  n 2  2  or
                                                                              0
                                                               2
                                                       1
                                                          1
                                                                             t   t  
 2,n 1  n 2  2
                                                                              0
                                                      H :      
    0        t 
 t  ,n 1  n 2  2
                                                       1
                                                               2
                                                          1
                                                                              0
                                                      H :           0        t 0    t  ,n 1  n 2  2
                                                               2
                                                          1
                                                       1
                 EXAMPLE 10-5      Two catalysts are being analyzed to determine how they affect the mean yield of a chemical
                                   process. Specifically, catalyst 1 is currently in use, but catalyst 2 is acceptable. Since catalyst
                                   2 is cheaper, it should be adopted, providing it does not change the process yield. A test is run
                                   in the pilot plant and results in the data shown in Table 10-1. Is there any difference between
                                   the mean yields? Use    0.05, and assume equal variances.
                                       The solution using the eight-step hypothesis-testing procedure is as follows:
                                       1. The parameters of interest are   and   , the mean process yield using catalysts
                                                                            2
                                                                     1
                                          1 and 2, respectively, and we want to know if        0.
                                                                                      2
                                                                                 1
                                       2. H :        0, or H :      2
                                                   2
                                                             0
                                                                1
                                            0
                                               1
                                   *While we have given the development of this procedure for the case where the sample sizes could be different, there
                                   is an advantage to using equal sample sizes n 1   n 2   n. When the sample sizes are the same from both populations,
                                   the t-test is more robust to the assumption of equal variances. Please see Section 10-3.2 on the CD.
   390   391   392   393   394   395   396   397   398   399   400