Page 399 - Applied Statistics And Probability For Engineers
P. 399

c10.qxd  5/16/02  1:31 PM  Page 343 RK UL 6 RK UL 6:Desktop Folder:TEMP WORK:MONTGOMERY:REVISES UPLO D CH114 FIN L:Quark Files:


                  10-3 INFERENCE FOR THE DIFFERENCE IN MEANS OF TWO NORMAL DISTRIBUTIONS, VARIANCES UNKNOWN  343


                                      99

                                      95
                                      90
                                      80
                                      70
                                     Percentage  50
                                      60
                                      40
                                      30
                                      20
                                      10
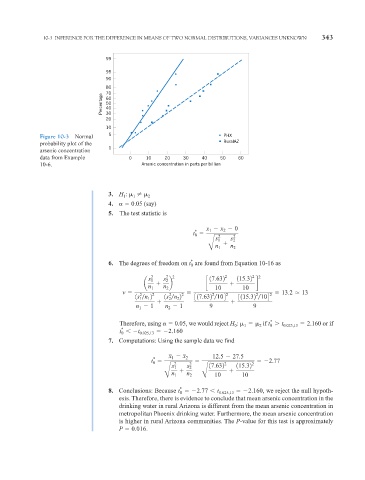
                 Figure 10-3  Normal   5                                   PHX
                 probability plot of the                                   RuralAZ
                                       1
                 arsenic concentration
                 data from Example           0     10    20   30    40    50    60
                 10-6.                           Arsenic concentration in parts per billion


                                       3. H :       2
                                            1
                                               1
                                       4.     0.05 (say)
                                       5.  The test statistic is

                                                                      x   x   0
                                                                       1
                                                                           2
                                                                  *
                                                                 t 0
                                                                         2    2
                                                                        s 1  s 2

                                                                        n    n
                                                                      B 1     2
                                                                 *
                                       6. The degrees of freedom on  are found from Equation 10-16 as
                                                                t 0
                                                   s 2 1  s 2 2        17.632 2  115.32 2 2
                                                         2
                                                  a       b           c              d
                                                   n 1  n 2             10       10
                                           v     2   2    2   2        2    2        2    2    13.2   13
                                               1s n 2     1s n 2  317.632 
104     3115.32 
104
                                                          2
 2
                                                 1
 1
                                               n   1     n   1         9            9
                                                          2
                                                1
                                                                                          *
                                                                               :      if  
 t        2.160 or if
                                          Therefore, using    0.05, we would reject H 0  1  2  t 0  0.025,13
                                           *
                                          t 0    t 0.025,13    2.160
                                       7. Computations: Using the sample data we find
                                                          x   x 2       12.5   27.5
                                                           1
                                                     *
                                                    t 0                                2.77
                                                            2   2          2        2
                                                           s 1  s 2    17.632  115.32
                                                           n     n  B
                                                        B 1     2       10       10
                                                             *
                                       8. Conclusions: Because t 0     2.77   t 0.025,13     2.160, we reject the null hypoth-
                                          esis. Therefore, there is evidence to conclude that mean arsenic concentration in the
                                          drinking water in rural Arizona is different from the mean arsenic concentration in
                                          metropolitan Phoenix drinking water. Furthermore, the mean arsenic concentration
                                          is higher in rural Arizona communities. The P-value for this test is approximately
                                          P   0.016.
   394   395   396   397   398   399   400   401   402   403   404