
Page 397 - Applied Statistics And Probability For Engineers
P. 397
c10.qxd 5/16/02 1:31 PM Page 341 RK UL 6 RK UL 6:Desktop Folder:TEMP WORK:MONTGOMERY:REVISES UPLO D CH114 FIN L:Quark Files:
10-3 INFERENCE FOR THE DIFFERENCE IN MEANS OF TWO NORMAL DISTRIBUTIONS, VARIANCES UNKNOWN 341
The Minitab two-sample t-test and confidence interval procedure for Example 10-5
follows:
Two-Sample T-Test and CI: Cat 1, Cat 2
Two-sample T for Cat 1 vs Cat 2
N Mean StDev SE Mean
Cat 1 8 92.26 2.39 0.84
Cat 2 8 92.73 2.99 1.1
Difference mu Cat 1 mu Cat 2
Estimate for difference: 0.48
95% CI for difference: ( 3.37, 2.42)
T-Test of difference 0 (vs not ): T-Value 0.35 P-Value 0.730 DF 14
Both use Pooled StDev 2.70
Notice that the numerical results are essentially the same as the manual computations in
Example 10-5. The P-value is reported as P 0.73. The two-sided CI on is also
1
2
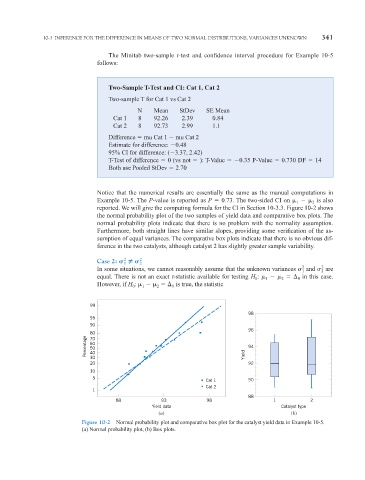
reported. We will give the computing formula for the CI in Section 10-3.3. Figure 10-2 shows
the normal probability plot of the two samples of yield data and comparative box plots. The
normal probability plots indicate that there is no problem with the normality assumption.
Furthermore, both straight lines have similar slopes, providing some verification of the as-
sumption of equal variances. The comparative box plots indicate that there is no obvious dif-
ference in the two catalysts, although catalyst 2 has slightly greater sample variability.
2
Case 2: 2 2
1
2
2
In some situations, we cannot reasonably assume that the unknown variances and are
1
2
equal. There is not an exact t-statistic available for testing H : in this case.
0
0
2
1
However, if H : is true, the statistic
0
0
2
1
99
98
95
90
96
80
Percentage 60 94
70
50
40
30 Yield
20 92
10
5
Cat 1 90
Cat 2
1
88
88 93 98 1 2
Yield data Catalyst type
(a) (b)
Figure 10-2 Normal probability plot and comparative box plot for the catalyst yield data in Example 10-5.
(a) Normal probability plot, (b) Box plots.