Page 41 - Applied Statistics And Probability For Engineers
P. 41

c02.qxd  5/10/02  1:07 PM  Page 24 RK UL 6 RK UL 6:Desktop Folder:TEMP WORK:MONTGOMERY:REVISES UPLO D CH114 FIN L:Quark Files:


               24     CHAPTER 2 PROBABILITY


                                                                                                     A ∩ B
                               A             B          A                  B            A           B


                                                   S                           S                          S


                                     (a)                           (b)                        (c)
                           Sample space S with events A and B
                                                        (A ∪ B) ∩ C                   (A ∩ C)'
                                             A             B             A             B


                                                                 S                          S
                                                        C                           C

                                                   (d)                         (e)
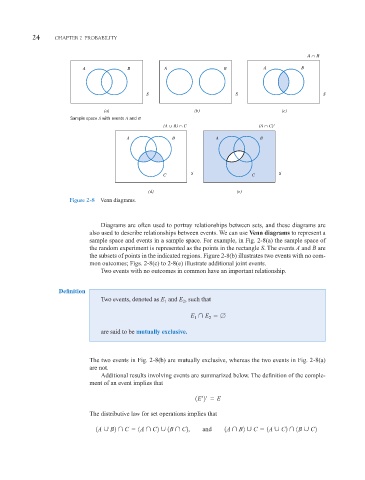
                           Figure 2-8  Venn diagrams.


                                    Diagrams are often used to portray relationships between sets, and these diagrams are
                                 also used to describe relationships between events. We can use Venn diagrams to represent a
                                 sample space and events in a sample space. For example, in Fig. 2-8(a) the sample space of
                                 the random experiment is represented as the points in the rectangle S. The events A and B are
                                 the subsets of points in the indicated regions. Figure 2-8(b) illustrates two events with no com-
                                 mon outcomes; Figs. 2-8(c) to 2-8(e) illustrate additional joint events.
                                    Two events with no outcomes in common have an important relationship.


                       Definition
                                    Two events, denoted as E and E , such that
                                                        1
                                                              2
                                                                   ¨ E
                                                                 E 1  2
                                    are said to be mutually exclusive.


                                 The two events in Fig. 2-8(b) are mutually exclusive, whereas the two events in Fig. 2-8(a)
                                 are not.
                                    Additional results involving events are summarized below. The definition of the comple-
                                 ment of an event implies that

                                                                  1E¿2¿   E

                                 The distributive law for set operations implies that

                                   1A ´ B2 ¨ C   1A ¨ C2 ´ 1B ¨ C2,   and   1A ¨ B2 ´ C   1A ´ C2 ¨ 1B ´ C2
   36   37   38   39   40   41   42   43   44   45   46