
Page 45 - Applied Statistics And Probability For Engineers
P. 45
c02.qxd 5/10/02 1:07 PM Page 28 RK UL 6 RK UL 6:Desktop Folder:TEMP WORK:MONTGOMERY:REVISES UPLO D CH114 FIN L:Quark Files:
28 CHAPTER 2 PROBABILITY
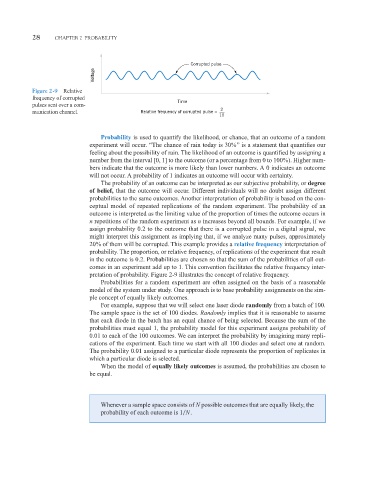
Corrupted pulse
Voltage
Figure 2-9 Relative
frequency of corrupted
Time
pulses sent over a com-
2
munication channel. Relative frequency of corrupted pulse =
10
Probability is used to quantify the likelihood, or chance, that an outcome of a random
experiment will occur. “The chance of rain today is 30%’’ is a statement that quantifies our
feeling about the possibility of rain. The likelihood of an outcome is quantified by assigning a
number from the interval [0, 1] to the outcome (or a percentage from 0 to 100%). Higher num-
bers indicate that the outcome is more likely than lower numbers. A 0 indicates an outcome
will not occur. A probability of 1 indicates an outcome will occur with certainty.
The probability of an outcome can be interpreted as our subjective probability, or degree
of belief, that the outcome will occur. Different individuals will no doubt assign different
probabilities to the same outcomes. Another interpretation of probability is based on the con-
ceptual model of repeated replications of the random experiment. The probability of an
outcome is interpreted as the limiting value of the proportion of times the outcome occurs in
n repetitions of the random experiment as n increases beyond all bounds. For example, if we
assign probability 0.2 to the outcome that there is a corrupted pulse in a digital signal, we
might interpret this assignment as implying that, if we analyze many pulses, approximately
20% of them will be corrupted. This example provides a relative frequency interpretation of
probability. The proportion, or relative frequency, of replications of the experiment that result
in the outcome is 0.2. Probabilities are chosen so that the sum of the probabilities of all out-
comes in an experiment add up to 1. This convention facilitates the relative frequency inter-
pretation of probability. Figure 2-9 illustrates the concept of relative frequency.
Probabilities for a random experiment are often assigned on the basis of a reasonable
model of the system under study. One approach is to base probability assignments on the sim-
ple concept of equally likely outcomes.
For example, suppose that we will select one laser diode randomly from a batch of 100.
The sample space is the set of 100 diodes. Randomly implies that it is reasonable to assume
that each diode in the batch has an equal chance of being selected. Because the sum of the
probabilities must equal 1, the probability model for this experiment assigns probability of
0.01 to each of the 100 outcomes. We can interpret the probability by imagining many repli-
cations of the experiment. Each time we start with all 100 diodes and select one at random.
The probability 0.01 assigned to a particular diode represents the proportion of replicates in
which a particular diode is selected.
When the model of equally likely outcomes is assumed, the probabilities are chosen to
be equal.
Whenever a sample space consists of N possible outcomes that are equally likely, the
probability of each outcome is 1
N .