
Page 50 - Applied Statistics And Probability For Engineers
P. 50
c02.qxd 5/10/02 1:07 PM Page 33 RK UL 6 RK UL 6:Desktop Folder:TEMP WORK:MONTGOMERY:REVISES UPLO D CH114 FIN L:Quark Files:
2-3 ADDITION RULES 33
2-3 ADDITION RULES
Joint events are generated by applying basic set operations to individual events. Unions of events,
such as A ´ B ; intersections of events, such as A ¨ B ; and complements of events, such as A¿ ,
are commonly of interest. The probability of a joint event can often be determined from the prob-
abilities of the individual events that comprise it. Basic set operations are also sometimes helpful
in determining the probability of a joint event. In this section the focus is on unions of events.
EXAMPLE 2-13 Table 2-1 lists the history of 940 wafers in a semiconductor manufacturing process. Suppose
one wafer is selected at random. Let H denote the event that the wafer contains high levels of
contamination. Then, P1H2 358
940 .
Let C denote the event that the wafer is in the center of a sputtering tool. Then,
P1C2 626
940. Also, P1H ¨ C2 is the probability that the wafer is from the center of the sput-
tering tool and contains high levels of contamination. Therefore,
P1H ¨ C2 112
940
The event H ´ C is the event that a wafer is from the center of the sputtering tool or
contains high levels of contamination (or both). From the table, P1H ´ C2 872
940 . An
alternative calculation of P1H ´ C2 can be obtained as follows. The 112 wafers that comprise
the event H ¨ C are included once in the calculation of P(H) and again in the calculation of
P(C). Therefore, P1H ´ C2 can be found to be
P1H ´ C2 P1H2 P1C2 P1H ¨ C2
358
940 626
940 112
940 872
940
The preceding example illustrates that the probability of A or B is interpreted as P1A ´ B2
and that the following general addition rule applies.
P1A ´ B2 P1A2 P1B2 P1A B2 (2-1)
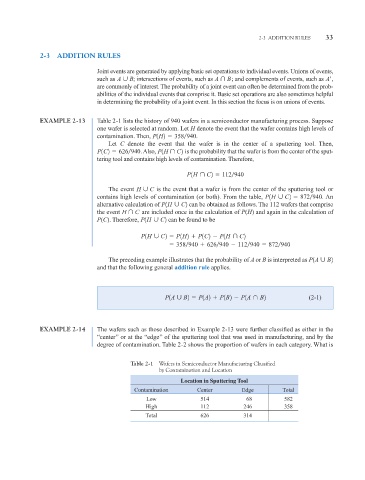
EXAMPLE 2-14 The wafers such as those described in Example 2-13 were further classified as either in the
“center’’ or at the “edge’’ of the sputtering tool that was used in manufacturing, and by the
degree of contamination. Table 2-2 shows the proportion of wafers in each category. What is
Table 2-1 Wafers in Semiconductor Manufacturing Classified
by Contamination and Location
Location in Sputtering Tool
Contamination Center Edge Total
Low 514 68 582
High 112 246 358
Total 626 314