
Page 97 - Applied Statistics And Probability For Engineers
P. 97
PQ220 6234F.Ch 03 13/04/2002 03:19 PM Page 75
3-6 BINOMIAL DISTRIBUTION 75
0.18 0.4
n p
n p
20 0.5 10 0.1
10 0.9
0.15
0.3
0.12
f(x) 0.09 f(x) 0.2
0.06
0.1
0.03
0 0
0 1 2 3 4 5 6 7 8 9 1011121314151617181920 0 1 2 3 4 5 6 7 8 9 10
x x
(a) (b)
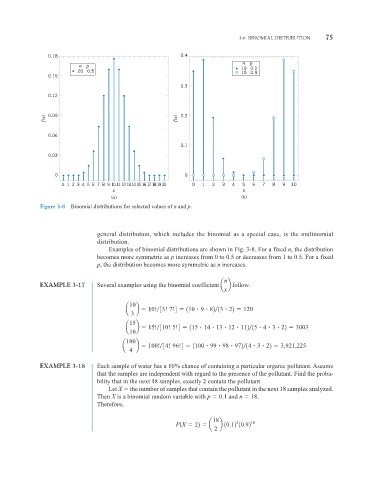
Figure 3-8 Binomial distributions for selected values of n and p.
general distribution, which includes the binomial as a special case, is the multinomial
distribution.
Examples of binomial distributions are shown in Fig. 3-8. For a fixed n, the distribution
becomes more symmetric as p increases from 0 to 0.5 or decreases from 1 to 0.5. For a fixed
p, the distribution becomes more symmetric as n increases.
n
EXAMPLE 3-17 Several examples using the binomial coefficient a b follow.
x
10
a b 10! 33! 7!4 110 9 82 13 22 120
3
15
a b 15! 310! 5!4 115 14 13 12 112 15 4 3 22 3003
10
100
a b 100! 34! 96!4 1100 99 98 972 14 3 22 3,921,225
4
EXAMPLE 3-18 Each sample of water has a 10% chance of containing a particular organic pollutant. Assume
that the samples are independent with regard to the presence of the pollutant. Find the proba-
bility that in the next 18 samples, exactly 2 contain the pollutant.
Let X the number of samples that contain the pollutant in the next 18 samples analyzed.
Then X is a binomial random variable with p 0.1 and n 18.
Therefore,
18
2
P1X 22 a b 10.12 10.92 16
2