
Page 325 - Applied statistics and probability for engineers
P. 325
Section 8-7/Tolerance and Prediction Intervals 303
planning to continue studying for an advanced degree. Con-
99
sider this as a random sample of the 1990 graduating class.
(a) Find a 90% conidence interval on the proportion of such 95
graduates planning to continue their education. 90
(b) Find a 95% conidence interval on the proportion of such
80
graduates planning to continue their education. 70
(c) Compare your answers to parts (a) and (b) and explain why Percent 60
50
they are the same or different. 40
(d) Could you use either of these conidence intervals to deter- 30
20
mine whether the proportion is actually 0.25? Explain your
answer. Hint: Use the normal approximation to the binomial. 10
5
8-111. An article in the Journal of Applied Physiology [“Humid-
ity Does Not Affect Central Nervous System Oxygen Toxicity” 1
(2001, Vol. 91, pp. 1327–1333)] reported that central nervous
10 20 30
system (CNS) oxygen toxicity can appear in humans on exposure
Latency
to oxygen pressures >180 kPa. CNS oxygen toxicity can occur
as convulsions (similar to epileptic seizures, grand mal) and loss
of consciousness without any warning symptoms. CNS oxygen (c) Find the 95% conidence interval for the mean.
toxicity is a risk encountered in several ields of human activity, (d) Explain why this check of the distribution underlying the
such as combat diving with closed-circuit breathing apparatus and sample data is important if you want to construct a coni-
diving with mixtures of nitrogen and oxygen (nitrox) or nitrogen, dence interval on the variance.
oxygen, and helium (trimix) in sport and professional diving to (e) Find the 95% conidence interval for the variance.
depths >30 μ. The risk of oxygen toxicity is always considered
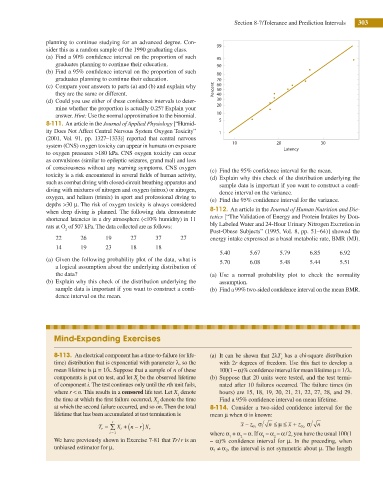
when deep diving is planned. The following data demonstrate 8-112. An article in the Journal of Human Nutrition and Die-
shortened latencies in a dry atmosphere (<10% humidity) in 11 tetics [“The Validation of Energy and Protein Intakes by Dou-
rats at O of 507 kPa. The data collected are as follows: bly Labeled Water and 24-Hour Urinary Nitrogen Excretion in
2
Post-Obese Subjects” (1995, Vol. 8, pp. 51–64)] showed the
22 26 19 27 37 27 energy intake expressed as a basal metabolic rate, BMR (MJ).
14 19 23 18 18
5.40 5.67 5.79 6.85 6.92
(a) Given the following probability plot of the data, what is 5.70 6.08 5.48 5.44 5.51
a logical assumption about the underlying distribution of
the data? (a) Use a normal probability plot to check the normality
(b) Explain why this check of the distribution underlying the assumption.
sample data is important if you want to construct a coni- (b) Find a 99% two-sided conidence interval on the mean BMR.
dence interval on the mean.
Mind-Expanding Exercises
8-113. An electrical component has a time-to-failure (or life- (a) It can be shown that 2λT has a chi-square distribution
r
time) distribution that is exponential with parameter λ, so the with 2r degrees of freedom. Use this fact to develop a
mean lifetime is μ = 1/λ. Suppose that a sample of n of these 100(1 –’α)% conidence interval for mean lifetime μ = 1 / λ.
components is put on test, and let X be the observed lifetime (b) Suppose that 20 units were tested, and the test termi-
i
of component i. The test continues only until the rth unit fails, nated after 10 failures occurred. The failure times (in
where r < n. This results in a censored life test. Let X denote hours) are 15, 18, 19, 20, 21, 21, 22, 27, 28, and 29.
1
the time at which the irst failure occurred, X denote the time Find a 95% conidence interval on mean lifetime.
2
at which the second failure occurred, and so on. Then the total 8-114. Consider a two-sided conidence interval for the
lifetime that has been accumulated at test termination is mean μ when σ is known:
r x − z È n≤ μ ≤ x+ z σ
T r = ∑ X i + ( n r X r ) α 1 α 2 n
−
i = 1 where α + α = α. If α = α = α / 2, you have the usual 100(1
1
2
2
1
We have previously shown in Exercise 7-81 that Tr / r is an – α)% conidence interval for μ. In the preceding, when
unbiased estimator for μ. α ≠ α 2 , the interval is not symmetric about μ. The length
1