Page 323 - Applied statistics and probability for engineers
P. 323
Section 8-7/Tolerance and Prediction Intervals     301


                     (c)  Based on this sample data, a 95% conidence interval for   99
                        the mean is (15.04, 15.62). Is it reasonable to infer that the
                        true mean could be 14.5? Explain your answer.    95
                                                                         90
                          99                                             80
                          95
                                                                         70
                          90                                             60
                          80                                            Percentage  50
                          70                                             40
                          60                                             30
                         Percentage  50                                  20 5
                                                                         10
                          40
                          30
                          20
                                                                          1
                          10
                           5                                               0      10      20      30      40     50
                                                                                            Strength
                           1
                                                                       (f)  Suppose that it was discovered that the largest observation
                           13.5  14.0  14.5  15.0  15.5  16.0  16.5  17.0
                                                                         40.2 was misrecorded and should actually be 20.4. Now the
                                        Hemoglobin level                                                  2
                                                                         sample mean x = 23 and the sample variance s  = 39.8. Use
                     (d) Explain why this check of the distribution underlying the   these new values and repeat parts (c) and (e). Compare the
                        sample data is important if we want to construct a coni-  original computed intervals and the newly computed inter-
                        dence interval on the variance.                  vals with the corrected observation value. How does this
                     (e)  Based on these sample data, a 95% conidence interval for   mistake affect the values of the sample mean, sample vari-
                        the variance is (0.22, 0.82). Is it reasonable to infer that the   ance, and the width of the two-sided conidence intervals?
                        true variance could be 0.35? Explain your answer.  (g) Suppose, instead, that it was discovered that the largest
                     (f)  Is it reasonable to use these conidence intervals to draw an   observation 40.2 is correct but that the observation 25.8
                        inference about the mean and variance of hemoglobin levels  is incorrect and should actually be 24.8. Now the sample
                        (i)  of Canadian doctors? Explain your answer.   mean x = 25 and the standard deviation s = 8.41. Use these
                        (ii)   of Canadian children ages 6–12? Explain your answer.  new values and repeat parts (c) and (e). Compare the origi-
                     8-99.  The article “Mix Design for Optimal Strength Develop-  nal computed intervals and the newly computed intervals
                     ment of Fly Ash Concrete” (Cement and Concrete Research,   with the corrected observation value. How does this mis-
                     1989, Vol. 19(4), pp. 634–640) investigates the compressive  take affect the values of the sample mean, the sample vari-
                     strength of concrete when mixed with ly ash (a mixture of  ance, and the width of the two-sided conidence intervals?
                     silica, alumina, iron, magnesium oxide, and other ingredients).   (h) Use the results from parts (f) and (g) to explain the effect of
                     The compressive strength for nine samples in dry conditions on   mistakenly recorded values on sample estimates. Comment
                     the 28th day are as follows (in megapascals):       on the effect when the mistaken values are near the sample
                                                                         mean and when they are not.
                        40.2     30.4     28.9     30.5     22.4
                                                                       8-100.     An operating system for a personal computer has
                        25.8     18.4     14.2     15.3                been studied extensively, and it is known that the standard devi-
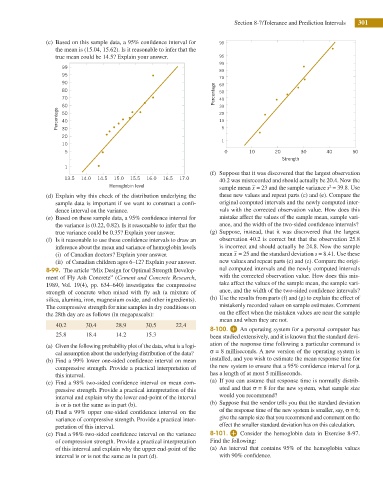
                     (a)  Given the following probability plot of the data, what is a logi-  ation of the response time following a particular command is
                        cal assumption about the underlying distribution of the data?  σ = 8 milliseconds. A new version of the operating system is
                     (b) Find a 99% lower one-sided conidence interval on mean  installed, and you wish to estimate the mean response time for
                        compressive strength. Provide a practical interpretation of   the new system to ensure that a 95% conidence interval for μ
                        this interval.                                 has a length of at most 5 milliseconds.
                     (c)  Find a 98% two-sided conidence interval on mean com-  (a)  If you can assume that response time is normally distrib-
                        pressive strength. Provide a practical interpretation of this   uted and that σ = 8 for the new system, what sample size
                        interval and explain why the lower end-point of the interval   would you recommend?
                        is or is not the same as in part (b).          (b)  Suppose that the vendor tells you that the standard deviation
                     (d) Find a 99% upper one-sided conidence interval on the  of the response time of the new system is smaller, say, σ = 6;
                        variance of compressive strength. Provide a practical inter-  give the sample size that you recommend and comment on the
                        pretation of this interval.                      effect the smaller standard deviation has on this calculation.
                     (e)  Find a 98% two-sided conidence interval on the variance   8-101.   Consider the hemoglobin data in Exercise 8-97.
                        of compression strength. Provide a practical interpretation   Find the following:
                        of this interval and explain why the upper end-point of the   (a) An interval that contains 95% of the hemoglobin values
                        interval is or is not the same as in part (d).   with 90% conidence.

