
Page 88 - Applied statistics and probability for engineers
P. 88
66 Chapter 3/Discrete Random Variables and Probability Distributions
Learning Objectives
After careful study of this chapter, you should be able to do the following:
1. Determine probabilities from probability mass functions and the reverse
2. Determine probabilities and probability mass functions from cumulative distribution functions and the
reverse
3. Calculate means and variances for discrete random variables
4. Understand the assumptions for some common discrete probability distributions
5. Select an appropriate discrete probability distribution to calculate probabilities in specifi c applications
6. Calculate probabilities and determine means and variances for some common discrete probability
distributions
3-1 Discrete Random Variables
Many physical systems can be modeled by the same or similar random experiments and random
variables. The distribution of the random variables involved in each of these common systems
can be analyzed, and the results can be used in different applications and examples. In this
chapter, we present the analysis of several random experiments and discrete random variables
that frequently arise in applications. We often omit a discussion of the underlying sample space
of the random experiment and directly describe the distribution of a particular random variable.
Example 3-1 Voice Lines A voice communication system for a business contains 48 external lines. At a par-
ticular time, the system is observed, and some of the lines are being used. Let the random variable
X denote the number of lines in use. Then X can assume any of the integer values 0 through 48. When the system is
observed, if 10 lines are in use, x = 10.
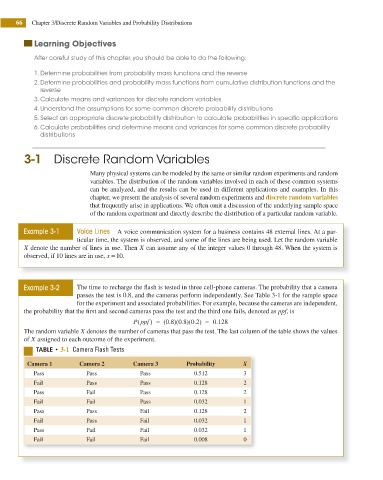
Example 3-2 The time to recharge the lash is tested in three cell-phone cameras. The probability that a camera
passes the test is 0.8, and the cameras perform independently. See Table 3-1 for the sample space
for the experiment and associated probabilities. For example, because the cameras are independent,
the probability that the irst and second cameras pass the test and the third one fails, denoted as ppf, is
P ppf ) = (0 8 )(0 8 )(0 2 ) = 0 128
(
.
.
.
.
The random variable X denotes the number of cameras that pass the test. The last column of the table shows the values
of X assigned to each outcome of the experiment.
5"#-& t 3-1 Camera Flash Tests
Camera 1 Camera 2 Camera 3 Probability X
Pass Pass Pass 0.512 3
Fail Pass Pass 0.128 2
Pass Fail Pass 0.128 2
Fail Fail Pass 0.032 1
Pass Pass Fail 0.128 2
Fail Pass Fail 0.032 1
Pass Fail Fail 0.032 1
Fail Fail Fail 0.008 0